What This Article Covers
- Why equipment breakdowns keep happening even when maintenance schedules are followed
- What changes operationally when AI is watching your equipment 24 hours a day
- How to calculate whether the business case closes for your site — with your own numbers
- What the system costs to build and run, with real figures
- What your team needs to make it work — and when to walk away from the idea entirely
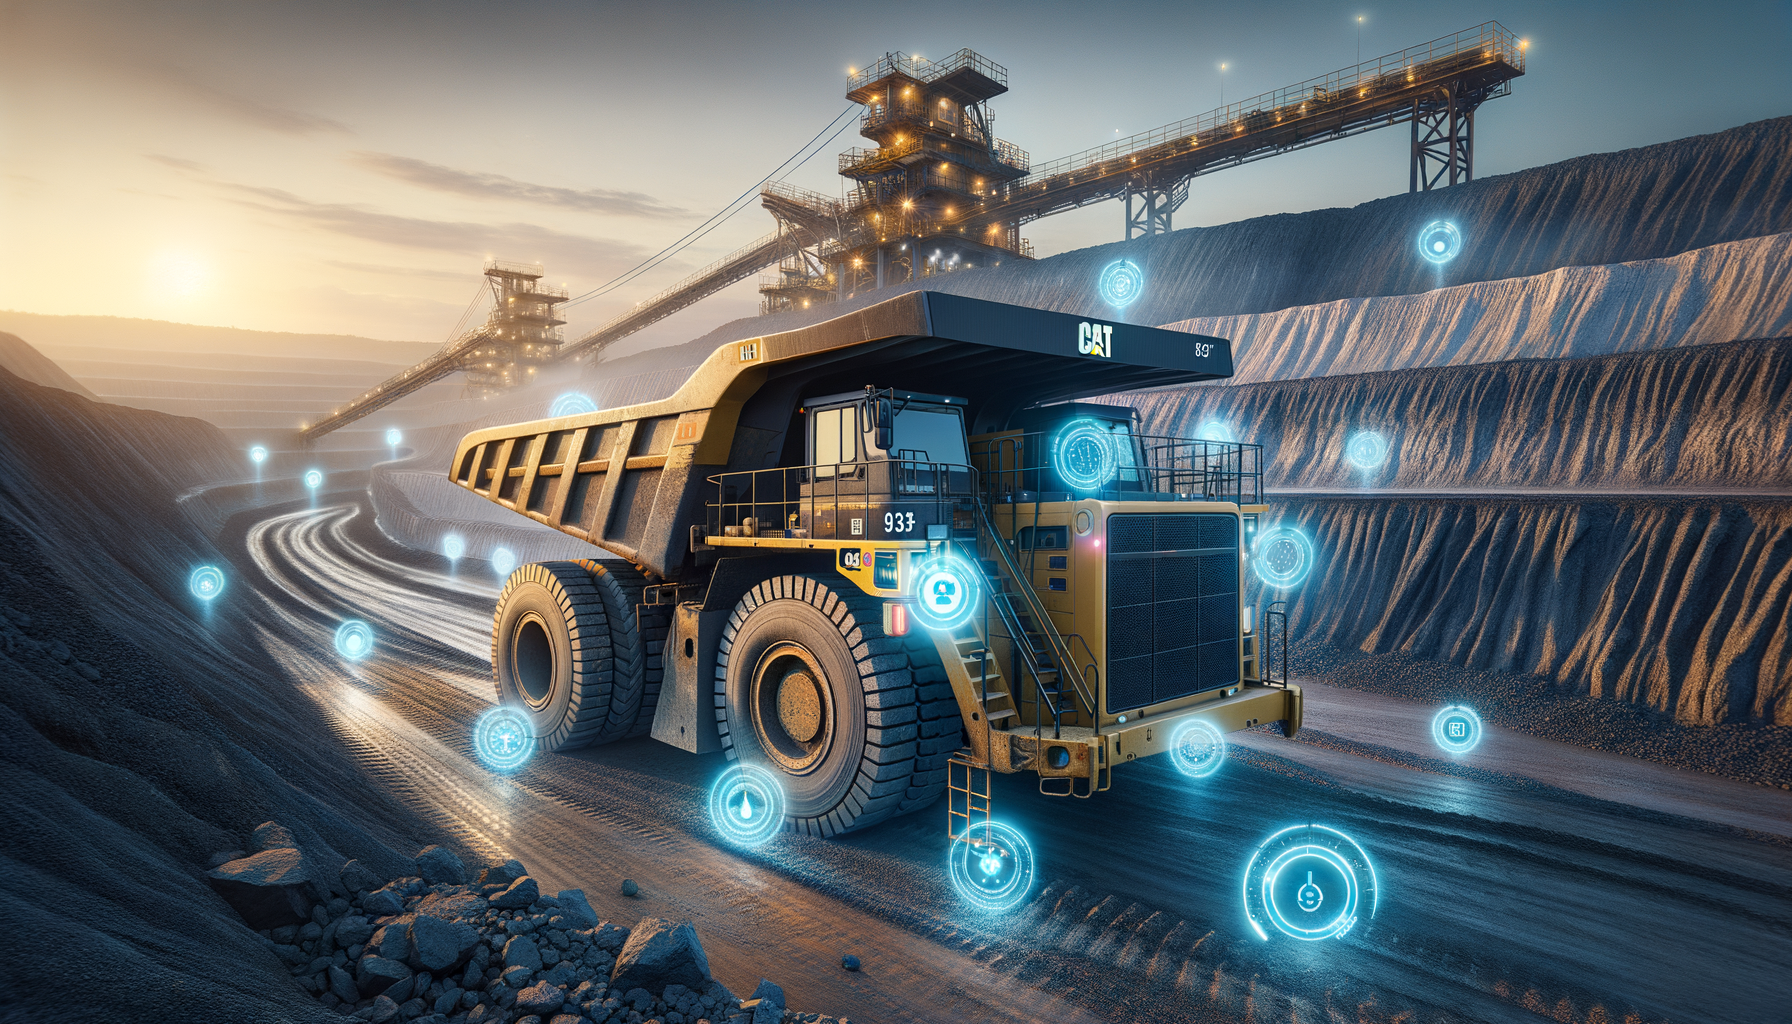
At 3 AM, a haul truck on the Hunter Valley night shift starts vibrating harder than usual. The operator notices but keeps moving — the shift is nearly done. Six hours later, the main bearing seizes. The truck is stranded. Sixty hours of recovery time, a $180,000 repair bill, and a production window gone.
The bearing had been failing for weeks. The signal was there in the sensor data. Nobody was watching it.
Now consider the same scenario with an AI predictive maintenance system in place. Three days earlier, the system detected an unusual pattern in that bearing's vibration signature. A work order was automatically raised, flagged as high priority, and assigned to the maintenance team. A technician replaced the bearing during a scheduled shift break. Total cost: $4,200 in parts and labour. Total downtime: zero.
That gap — $180,000 and 60 hours versus $4,200 and nothing — is what this technology is designed to close. This article explains how it works, what it costs, and how to decide whether it makes sense for your site.
1. Is This Right for Your Site?
I'll address this upfront because it's the question most articles bury at the end, and it's the one you need answered before anything else. This approach works well in some situations and poorly in others. If your site doesn't fit the profile, I'll tell you what to do instead.
This works well if:
- Your fleet has 10 or more heavy assets (haul trucks, draglines, conveyors) that are already instrumented with sensors — or where sensors can be installed
- You have at least 12 months of maintenance records with timestamps on failure events — the AI needs real examples to learn from
- Unplanned breakdowns are costing you more than $1.5M per year across the fleet — below that, the economics are marginal
- Your maintenance team has capacity to respond to advance alerts — a 24-hour warning is useless if there's nobody to act on it
- You are running OEE below 85% and equipment availability is a known constraint on production
Walk away if:
- Your fleet is fewer than 8–10 assets. The infrastructure cost (roughly $35,000/year) and project investment ($400k+) rarely close at that scale. A structured oil-sampling programme with weekly lab turnaround will serve you better.
- You don't have historical failure data. An AI model trained on synthetic patterns won't detect failures specific to your equipment under your site conditions. You'd be buying guesswork.
- Your maintenance team is already overstretched. An alert that nobody acts on teaches your team to ignore the system. Fix the resourcing constraint first.
- Your equipment is near end-of-life. Retrofitting sensors on a fleet you plan to replace in 18 months rarely makes financial sense. Specify sensors at the time of new equipment purchase — dramatically cheaper.
2. What Changes on Monday Morning
Before getting into how the system works, it helps to understand what it actually changes day-to-day. The technology is a means to an end — and the end is a different kind of Monday morning for your maintenance coordinator.
Before: Reactive and Time-Based
The maintenance coordinator starts their shift reviewing overnight breakdown reports. Truck T-047 seized at 2 AM — the tyre team is already out, but the crane hire to right the machine won't arrive until noon. Two other trucks are due for their 1,500-hour major service this week, regardless of condition. The oil sample results from last week's sampling round came back — one result is borderline, the next sample is due in two weeks. A decision gets made to watch it.
This is the pattern most sites run on: a mix of responding to what just broke and servicing on a schedule that has no connection to how individual machines are actually performing.
After: Anticipatory
The maintenance coordinator starts their shift reviewing the overnight alert queue. Two alerts came in during the night. The first: Truck T-047's front left bearing has been showing a deteriorating pattern for 72 hours — the system is estimating 18–24 hours before failure and has automatically raised a high-priority corrective maintenance work order in the system. A technician has already been assigned. The second: a conveyor belt tension reading spiked briefly at 3 AM but returned to baseline — the system logged it as a watch item, no action required.
The coordinator didn't have to find either of these. They were surfaced, prioritised, and in one case already actioned before the shift began.
The shift in mindset is from "what broke last night?" to "what do we need to act on in the next 24 hours?" That's a fundamentally different relationship with your equipment — and with your production schedule.
3. The Business Case — Run Your Own Numbers
The headline figure — 50–70% reduction in unplanned downtime — comes from aggregated outcomes across Australian and Canadian mining deployments. The range is wide because it depends heavily on your starting baseline. A site with 20 unplanned incidents per year sees a bigger absolute saving than one with 6. Conservative planning should use 55–60% reduction, not the top of the range.
The calculator below lets you estimate the opportunity against your own site. It assumes a 60% reduction in incidents and infrastructure running costs of approximately $35,000 per year. It does not include the additional 25% reduction in planned maintenance labour costs that typically follows, nor the benefit of improved production scheduling certainty.
ROI Calculator
Adjust the sliders to match your site. Results update in real time.
Assumes: 60% incident reduction, $35k/year infrastructure running cost, $450k base project cost + $3,500 per asset for sensor hardware. Excludes the ~25% reduction in planned maintenance spend that typically follows.
Unplanned Downtime Hours Per Quarter — Hunter Valley Site A
2024: reactive maintenance baseline. 2025: AI predictive system deployed in Q1, gaining accuracy through the year. By Q3–Q4 the reduction is fully established.
The chart reflects something worth understanding before you go into a board presentation: the reduction is not immediate. In the first quarter after deployment the system is learning your site's normal patterns. By month 6–9, with enough confirmed failure events to learn from, detection accuracy is where you want it. Plan for the savings to ramp over a 12-month period, not to appear in full on day one.
4. How the System Works
The diagram below shows the full flow from sensor to action. The explanation that follows translates each stage into plain terms.
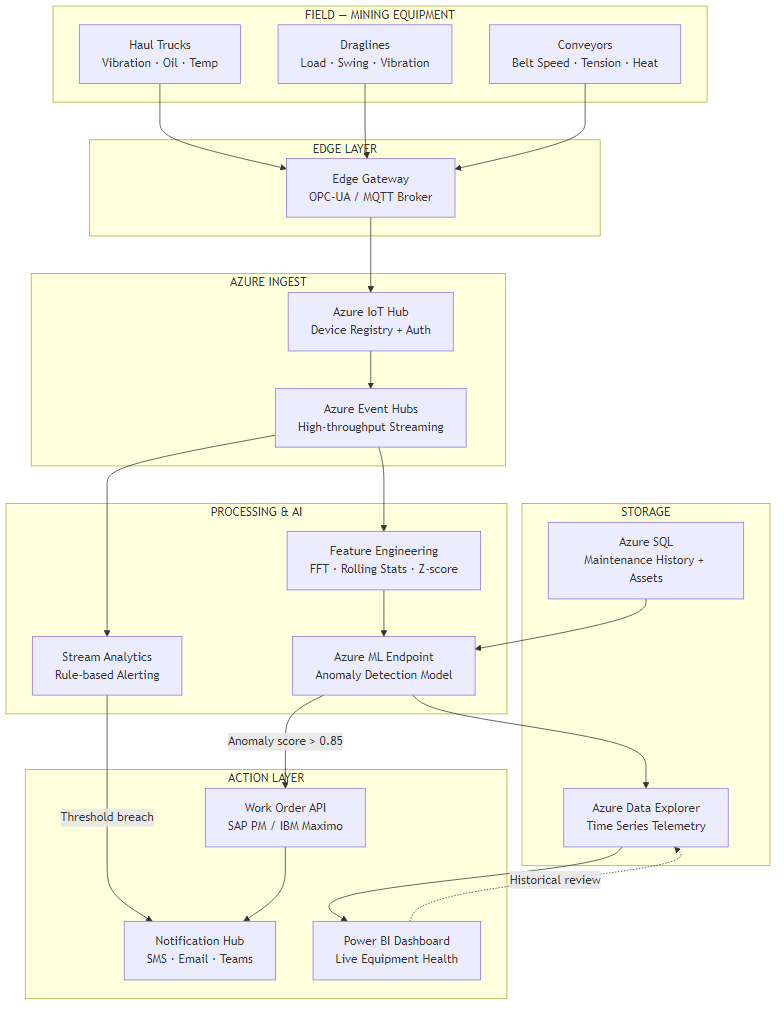
Six Stages, Plain English
Stage 1 — Sensors on the equipment. Modern haul trucks and draglines already carry a range of onboard sensors: vibration monitors on bearings and axles, temperature probes on engines and hydraulic lines, oil pressure gauges, and load cells. On older equipment, additional sensors can be retrofitted. These devices measure continuously — in most configurations, once per second or faster.
Stage 2 — Edge gateway on site. An industrial computer installed at the mine site (typically in the electrical workshop or control room) collects readings from all equipment and packages them for transmission. This device also acts as a buffer — if connectivity to the cloud drops, readings are stored locally and transmitted when the link restores. No data is lost during network outages.
Stage 3 — Secure cloud connection. Readings travel over an encrypted connection to a secure cloud receiving hub (in Australia, hosted in Microsoft's Azure Sydney data centre). Each piece of equipment has its own authenticated identity — no unauthorised device can inject false readings into the system.
Stage 4 — Two layers of checking. When readings arrive, they pass through two parallel checks. The first is a simple rule engine: if a temperature reading exceeds a hard limit, trigger an immediate alert regardless of anything else. This replaces and improves the threshold alarms your SCADA system already has. The second is the AI model, which looks at patterns across time rather than a single reading in isolation — this is where the genuinely early detection happens.
Stage 5 — Work order creation. When the AI model identifies a developing fault with sufficient confidence, it automatically creates a corrective maintenance work order in your existing maintenance management system — SAP PM or IBM Maximo, whichever you use. The work order arrives pre-filled with the asset ID, the recommended action, the priority level, and the estimated time window. Your maintenance coordinator doesn't have to find the fault, raise the job, or assess the priority. It's done.
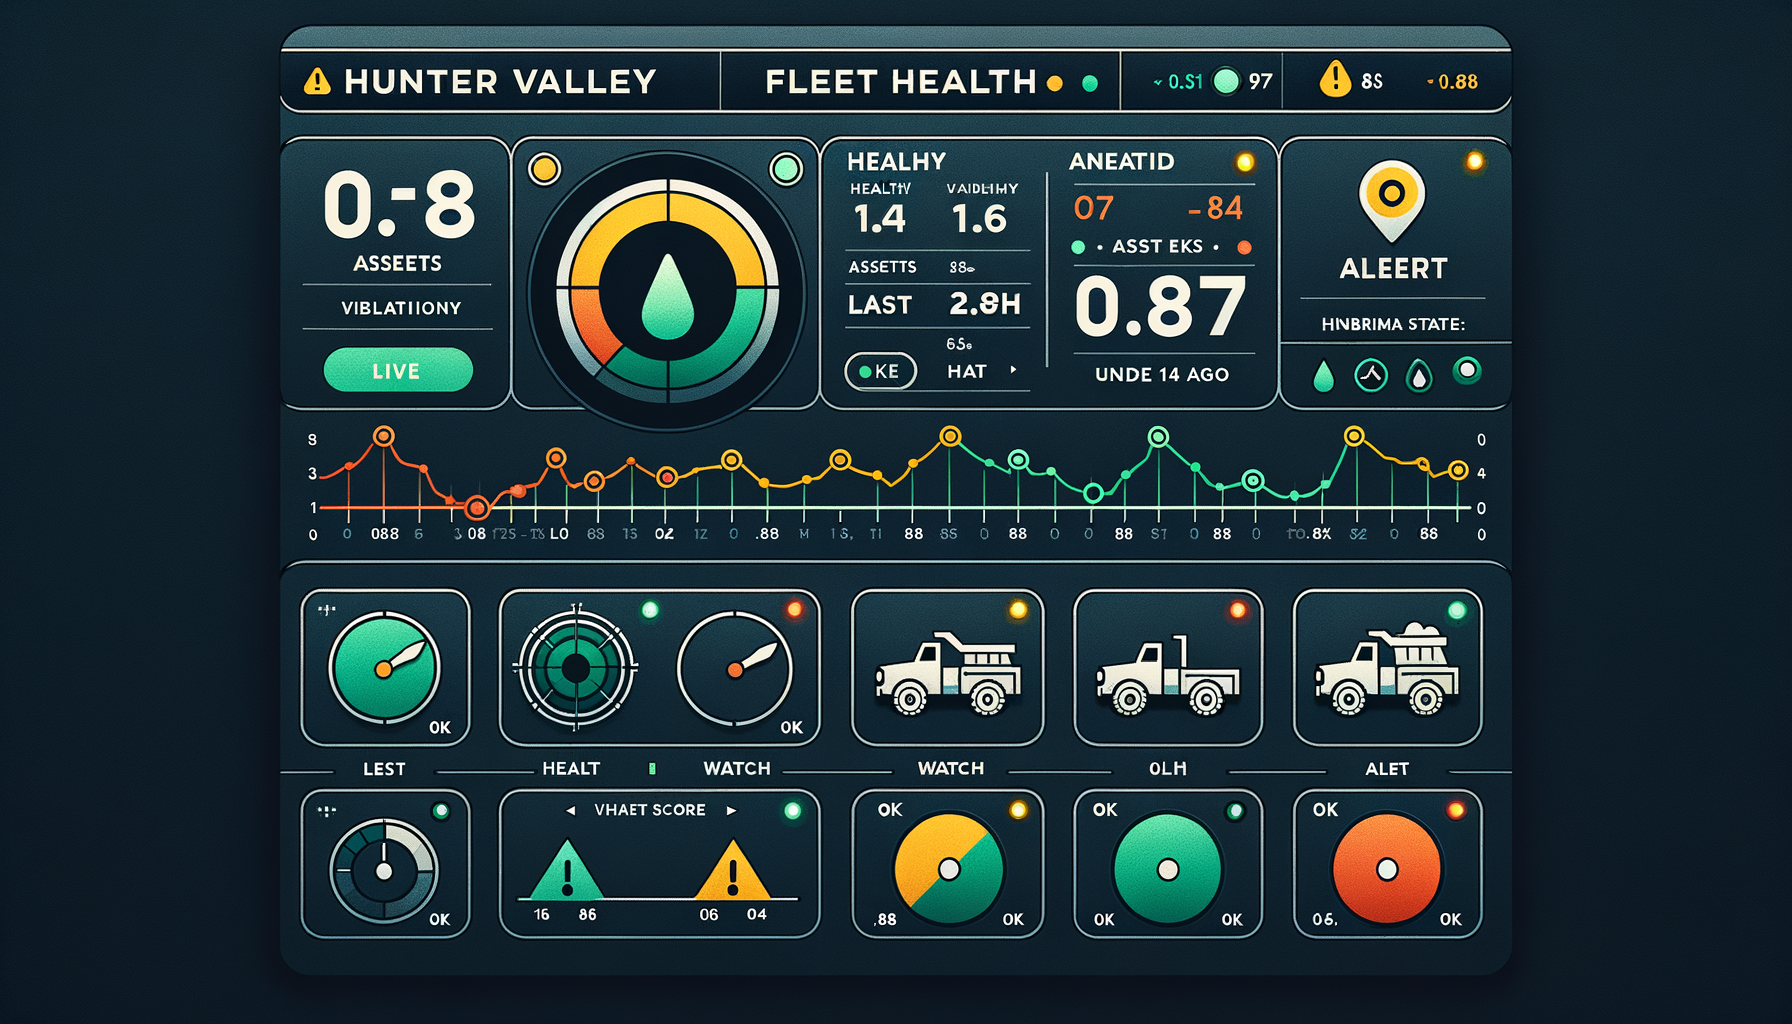
Stage 6 — Live dashboard and historical records. All readings, all scores, and all alerts are stored for historical analysis. Maintenance managers can query equipment health trends across the fleet, review which asset types generate the most alerts, and pull the data they need for capital planning decisions. All of this is visible in a live dashboard accessible from the control room or remotely.
5. How the AI Learns to Spot Failure Weeks Early
The most common question I get from operations managers is: if the sensor data was already being collected, why couldn't we spot the failures earlier ourselves?
The answer is in what you have to look at. A bearing rotating inside a haul truck wheel generates vibration. When it's healthy, that vibration is spread evenly across a wide range of frequencies — like a clear musical chord. When a small defect develops on the bearing surface, it adds a very specific frequency to that mix — a particular note that doesn't belong. The problem is that this off-note is buried inside thousands of other readings, it changes subtly over weeks, and it looks superficially similar to the vibration spikes you'd see from a truck crossing a rough section of haul road.
A human reviewing a dashboard can't reliably pick out that off-note from the noise, across 40 trucks, 24 hours a day, in the context of all the normal operational variation. The AI can — because it has learned the specific frequency signature that precedes bearing failure on your equipment type, under your operating conditions, from historical failure events on your site.
Why Static Threshold Alarms Don't Solve This
Your SCADA system already has threshold alarms — if vibration exceeds a limit, a light comes on. The problem is that setting the threshold low enough to catch early-stage faults means it fires every time a truck hits a ramp or loads up at the shovel. Setting it high enough to avoid constant false alarms means it only catches failures that are already severe. This is why most sites have either alert fatigue (everyone ignores the alarms) or threshold creep (the limit gets raised until the alarm is effectively turned off).
The AI solves this by understanding context — the difference between "high vibration because the truck is climbing a grade" and "high vibration with a specific developing signature." That distinction can't be captured in a single number.
Tuning the Sensitivity
One decision your team will make during deployment is how sensitive to set the detection system. Think of it like a smoke detector dial. Too sensitive: the alarm fires every time someone makes toast, and people start ignoring it. Too low: it misses a real fire developing slowly in the walls.
In practice, the right setting for most sites catches roughly 85–90% of real developing faults while generating fewer than three false alarms per week across the full fleet. Your team will review false alarms during the first 8 weeks and the technical team adjusts the sensitivity based on what they find. It's an iterative process, not a one-time configuration.
6. What It Costs to Build and Run
I'll separate one-time project costs from ongoing running costs, because they come from different budgets and are approved through different processes.
Ongoing Running Costs (Annual)
| Component | What It Does | Approx. Annual Cost (AUD) |
|---|---|---|
| Cloud infrastructure | Receives, stores, and processes all sensor data | $22,000–$35,000 |
| AI scoring service | Runs the anomaly detection model continuously | $5,500–$8,000 |
| Dashboards and reporting | Live fleet health views for ops and maintenance teams | $1,200–$2,400 |
| Model maintenance and retraining | Keeps the AI current as equipment and site conditions change | $15,000–$30,000 |
| Total annual running cost | For a 20-truck site | ~$44,000–$75,000/year |
One-Time Project Costs
| Component | Cost Range (AUD) | Notes |
|---|---|---|
| Sensor hardware and installation per asset | $3,000–$6,000 | Lower if existing sensors are reusable; higher for older equipment |
| Site edge gateway and network | $18,000–$35,000 | Per site; covers the on-premises hardware and connectivity setup |
| AI model build, training, and validation | $80,000–$150,000 | Includes historical data analysis and model testing against past failures |
| Integration with SAP PM or IBM Maximo | $45,000–$90,000 | Varies significantly by EAM system version and configuration complexity |
| Dashboards and training | $20,000–$40,000 | Includes maintenance coordinator and management reporting setup |
| Total project (20-asset site) | $400,000–$650,000 | Wider range reflects existing sensor estate and EAM complexity |
The Number That Surprises Most People
The AI model itself — the software that detects the anomalies — is not the expensive part. Cloud infrastructure and AI scoring together is under $45k per year. The project cost is dominated by sensor hardware, the integration with your existing maintenance management system, and the work to make the AI model specific to your equipment and failure history. Be sceptical of any vendor quoting a low project cost that doesn't include EAM integration — that's where the complexity lives.
Where Your Maintenance Spend Currently Goes
The red slice — reactive repairs — is the target. AI predictive maintenance shifts spend from reactive repairs into more cost-effective planned work.
7. What Your Team Needs to Make This Work
This is the section most vendor proposals skip. The technology works — but only if the organisational conditions around it are right. Here's what I've seen derail otherwise sound projects.
The Internal Team You Need
You don't need to hire new roles for this, but you need existing people with enough bandwidth to engage:
- One OT/SCADA engineer who understands how your equipment communicates — how sensor data currently flows through your control systems, and what's needed to connect it to the cloud. This person is your bridge between the equipment and the technology team.
- One IT or systems engineer with cloud infrastructure experience, or the appetite to develop it. This person manages the Azure environment and keeps the data pipeline running. If this doesn't exist internally, it's the first thing to contract out.
- Maintenance coordinators who will act on alerts. This sounds obvious, but it's where deployment silently fails. If the coordinator's workflow doesn't change to accommodate reviewing the overnight alert queue each morning, the system becomes an expensive dashboard nobody uses.
What to Build vs. What to Buy
The model training, cloud architecture, and EAM integration are specialist work. Most mine sites don't have this capability in-house and shouldn't try to build it — the learning curve extends your timeline by 6–12 months and the risk of a poorly trained model is that it misses failures and erodes trust in the whole system before it has a chance to prove itself.
What you should keep internal: the domain knowledge. Your maintenance team knows which failure modes cost the most, which assets are most critical to production flow, and what a real alert looks like versus a false one. That knowledge is what shapes a useful AI model. The vendor builds the technology; your people make it specific to your operation.
Realistic Timeline
| Phase | Timeline | What Happens |
|---|---|---|
| Sensor installation and data pipeline | Weeks 1–8 | Hardware installed on pilot asset (typically the most critical piece of equipment), data flowing to cloud, basic dashboards live |
| Model training and validation | Weeks 6–16 | Historical failure data analysed, model trained and tested against known past failures, false positive rate established |
| EAM integration and work order flow | Weeks 10–20 | Alerts connected to SAP PM or Maximo, maintenance coordinator workflow updated, alerting tested end-to-end |
| Full fleet rollout | Months 4–6 | Remaining assets onboarded, model tuned for each asset type, operations reporting in place |
| Steady-state accuracy | Month 9–12 | Model has seen enough real failure events to reach 85–90% detection accuracy; savings fully realised |

8. How You Know the System Is Working
Once deployed, the KPIs that tell you whether the system is delivering are straightforward. These are management metrics, not technical ones — they belong in your monthly operations review, not an IT report.
| Metric | What to Track | Target (12 months in) |
|---|---|---|
| Unplanned downtime hours | Fleet total per month vs. pre-deployment baseline | 50–70% reduction |
| Alert-to-action time | Average hours between alert raised and technician attendance | Under 8 hours for high-priority |
| False alarm rate | Work orders raised by AI where no fault was found | Below 15% of all AI-generated work orders |
| Cost per maintenance event | Total maintenance spend divided by number of events | Trending down as reactive repairs are replaced by planned work |
| Missed failure rate | Failures that occurred without a prior AI alert (tracked retrospectively) | Below 10% of all failure events |
The false alarm rate deserves particular attention in the first 3 months. If it runs above 20%, your maintenance team will start dismissing alerts before investigating — the same alert fatigue problem that makes SCADA threshold alarms ineffective. Catching this early and adjusting the system's sensitivity is straightforward; letting alert fatigue take hold is much harder to reverse.
9. Where to Start
If the ROI calculator showed a compelling case for your site, and your operation fits the profile in Section 1, here is the sequence that gives you the fastest, most defensible path to a working system:
- Start with one critical asset, not the whole fleet. Pick the asset type that generates the most expensive failures — typically the primary dragline or the largest-capacity haul trucks. A working system on one asset in 8 weeks is a better investment argument than a fleet-wide proposal that takes 18 months to prove.
- Audit your maintenance history before you brief any vendor. Pull 18–24 months of failure events with timestamps, asset IDs, and failure descriptions. This data is what the AI model is trained on. If it's incomplete or poorly structured, that's the first thing to fix — not the technology procurement.
- Map your sensor estate before you budget for new hardware. Many sites already have usable sensor data flowing through SCADA systems that nobody has wired to a cloud pipeline. What you have may significantly reduce the hardware cost.
- Involve your maintenance coordinator in vendor selection. The coordinator who will use the alert queue every morning has better instincts about what makes an alert actionable than any procurement team. Their buy-in is the difference between a tool people use and a dashboard nobody opens.
- Set a hard false-alarm budget in your vendor contract. Specify that the system must reach below 15% false alarms within 6 months of full deployment, with a remediation clause. This focuses the vendor's model tuning effort in the right direction.
Key Takeaways
The Decisions This Article Is Designed to Help You Make
- Is the opportunity real for your site? Use Section 1's checklist and the ROI calculator. If the payback is under 24 months, the case is strong. If it's over 36 months, look at the simpler alternatives first.
- What are you actually buying? A system that monitors your equipment continuously, spots developing failures weeks ahead of time, and automatically raises work orders — so your maintenance team responds to advance warning rather than breakdown reports.
- What does it cost? $400k–$650k one-time project cost for a 20-asset site, $44k–$75k per year to run. The EAM integration is where the complexity and cost concentration sits.
- How long does it take? First alerts in 8 weeks. Full fleet, full accuracy: 9–12 months.
- What can go wrong? Alert fatigue if false alarms aren't managed, a model that never gets accurate enough because historical failure data was poor, and an integration that sits disconnected from the maintenance coordinator's actual workflow. All three are avoidable with the right vendor and internal ownership.
Want Practical Insights on AI in Operations?
I write about applying AI to real business problems — with honest numbers and no vendor speak. Subscribe for articles delivered twice a month.
Subscribe to Newsletter →