What This Article Covers
- Why mine planning decisions made without simulation leave significant ore value in the ground on every blast
- What changes operationally when engineers can test a drill pattern in a virtual mine before the first hole is drilled
- How to estimate the yield improvement opportunity for your site's throughput and ore value
- What building and running a digital twin actually costs — with real figures
- When a digital twin delivers strong returns and when the data quality isn't there to make it worthwhile
A blasting contractor submits a revised drill pattern for the next cut at a Moolarben open-cut operation. Under the current planning process, engineers spend three days running manual calculations against the geological model. The pattern is approved. The blast goes ahead. The fragmentation comes out 22% coarser than planned. The primary crusher runs at 71% of design capacity for five weeks. Total cost of that one planning decision: $1.8 million in lost throughput.
The geological data that would have flagged the problem was in the system. The fragmentation model that would have predicted the coarse output existed. What was missing was a way to run the simulation before the bulldozers moved — quickly enough to be useful, and accurately enough to trust.
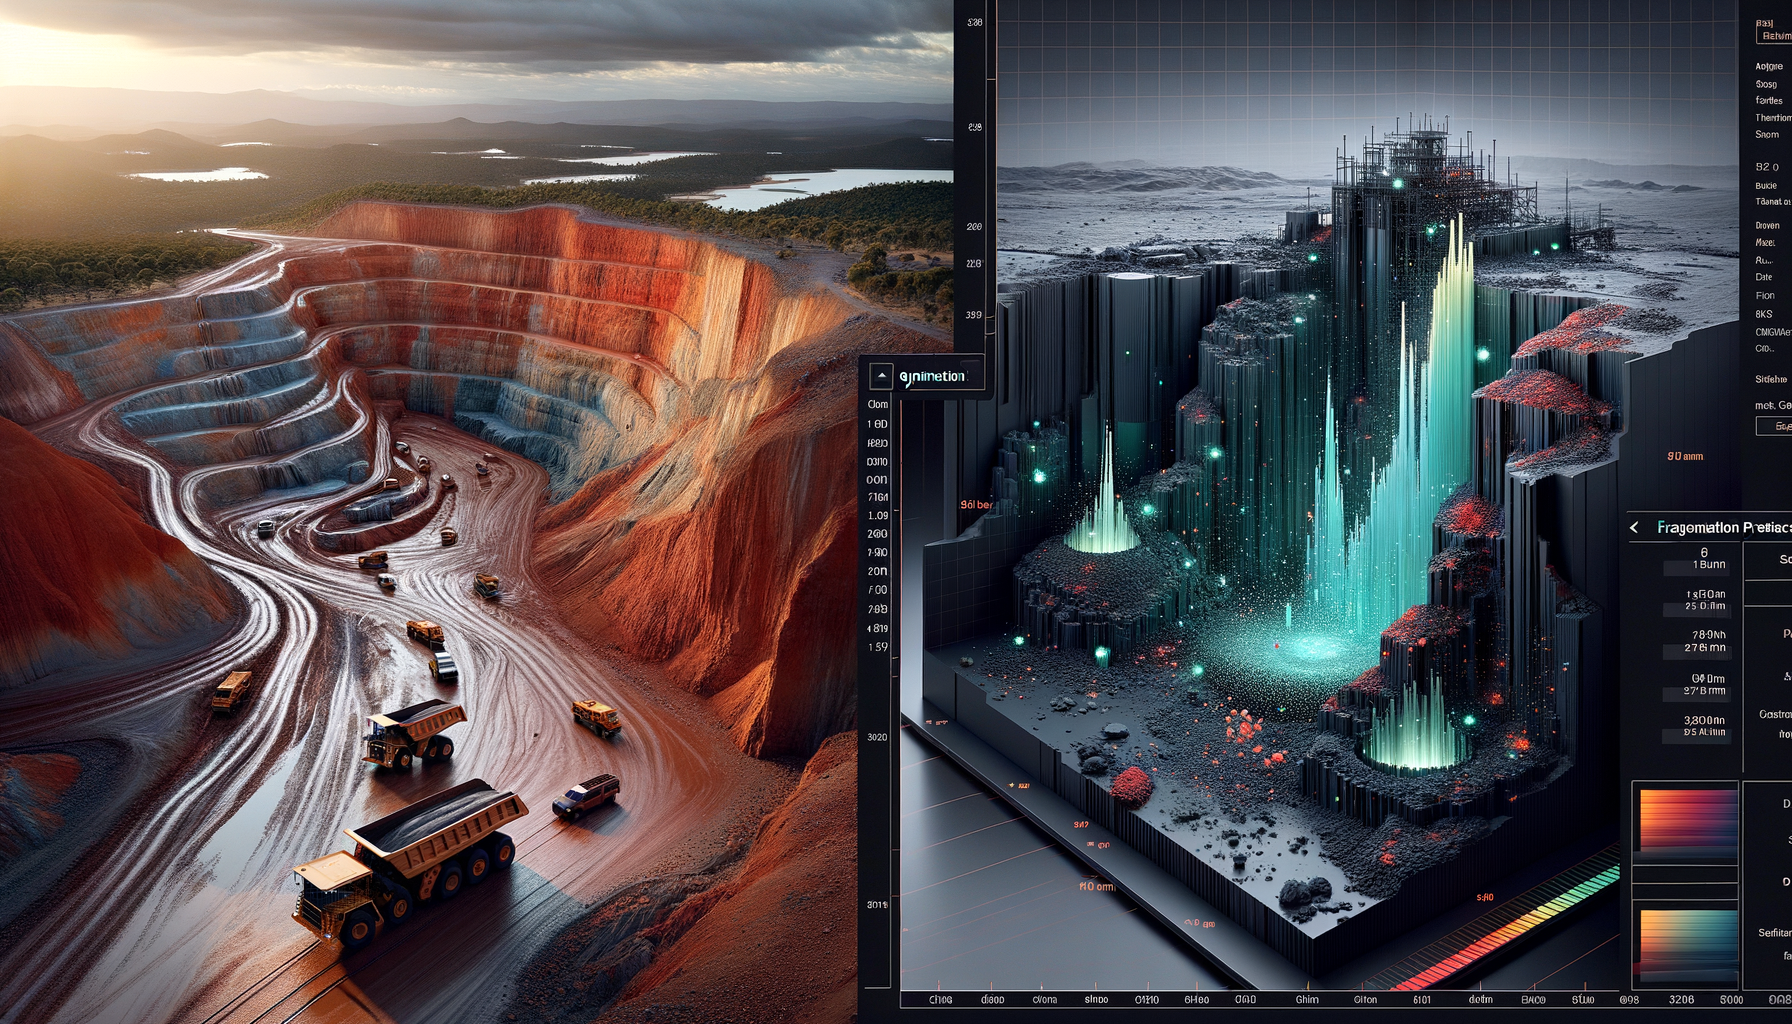
A digital twin changes that calculation entirely. The proposed drill pattern runs through the virtual mine model in 4 hours. The fragmentation simulation flags the coarseness risk before a single hole is drilled. Engineers adjust the burden and spacing. The revised blast achieves 94% of target fragmentation. The crusher runs at full capacity. The $1.8 million stays on the revenue side.
That is the specific value proposition of a mining digital twin: not a flashy visualisation of the pit, but a model accurate enough to make planning decisions you can act on before committing capital and machinery.
1. Is This Right for Your Operation?
I'll address this upfront. Digital twins deliver strong returns at operations that already have reasonable data infrastructure and a planning function that can act on simulation outputs. They deliver little at sites where the underlying data is too sparse or too old to produce an accurate model.
This works well if:
- Your operation processes more than 2 million tonnes per year — below that threshold, the model cost typically exceeds the yield improvement value
- You have drill and blast records going back at least 18 months with actual fragmentation or throughput outcomes captured alongside the drill parameters — this is what the model learns from
- Your geological survey data is current — ideally updated quarterly or better. A digital twin built on 12-month-old survey data reflects a pit that no longer exists
- Your planning team currently makes more than 15 blast planning decisions per quarter — enough volume for the simulation to generate savings that outpace the running cost
- You have an identified yield gap — either your ore recovery rate is below comparable operations, your strip ratio is trending upward without geological justification, or your crusher throughput is consistently below design capacity
Walk away if:
- Your site survey data is more than 6 months old and nobody has scheduled a refresh. A digital twin is only as accurate as its inputs. Building a model on outdated survey data produces simulations that diverge from reality quickly — and planning decisions based on those simulations will make your yield problem worse, not better.
- Your drill and blast records don't capture actual outcomes. If records show drill parameters but not what the blast actually produced — fragmentation size distribution, muck pile profile, crusher feed quality — the model has nothing to calibrate against. You'd be building a simulation on assumptions, not data.
- Your planning team doesn't have time to use it. A digital twin that runs simulations nobody reviews doesn't improve yield. The value is in the decision that changes based on what the model shows. If the planning function is already at capacity, the tool will go unused.
- Your operation is in wind-down or the mine life is under 3 years. The model improves over time as it captures more site-specific data. A short remaining mine life doesn't give it enough runway to generate the payback.
2. What Changes on Monday Morning
Digital twin technology often gets described in terms of the 3D model — the visualisation of the pit. The visualisation is the least important part. What actually changes is how planning decisions get made, and how quickly.
Before: Plan, Commit, Discover
The planning engineer receives the proposed drill pattern from the contractor on Wednesday. They run it against the geological block model manually — a process that takes a full day for a complex cut. On Thursday afternoon, they present it to the mine manager. The pattern is approved based on the engineer's experience, the block model, and the contractor's track record on similar cuts. The drilling commences Friday. The blast happens Monday. By Tuesday afternoon, the first evidence of how the pattern actually performed starts coming through the crusher feed.
If the fragmentation was off — too coarse, muck pile profile too high for the dig, ROM too variable for the plant — the response is reactive. Adjust the next pattern. Accept the throughput hit on this one. The planning cycle is 5–7 days, and feedback from each blast doesn't make it back into the next planning decision in time to matter.
After: Simulate, Refine, Commit
The planning engineer receives the proposed drill pattern on Wednesday. They run it through the digital twin — the geological model, the historical blast performance at this section of the pit, the current plant throughput constraints, and the fragmentation model calibrated against 18 months of actual outcomes. The simulation takes 4 hours. By Wednesday afternoon, they have predicted fragmentation distribution, estimated muck pile geometry, and a projected crusher feed quality score.
The simulation flags a coarseness risk in the eastern corner of the pattern — a harder geological zone the contractor's pattern hadn't accounted for. The engineer adjusts the burden spacing in that zone. The revised simulation runs in 90 minutes. The adjusted pattern is approved Thursday morning. Drilling commences Friday. Monday's blast performs within 6% of the predicted fragmentation target.
The shift in mindset is from "plan, blast, discover" to "simulate, refine, commit." Every planning decision becomes testable before it costs you machinery hours and ore value.
3. The Business Case — Run Your Own Numbers
The 12% ore recovery improvement figure comes from documented outcomes across Australian and Canadian open-cut coal and metalliferous operations. The range in practice is 8–16%, with the higher end achieved at operations where the pre-digital-twin planning process was most manual and the ore body most variable. Conservative planning should assume 10–12%, not the top of the range.
The calculator below estimates the opportunity in dollar terms against your operation's throughput and ore value. It uses a 12% recovery improvement assumption and an annual running cost of $150,000 — which covers cloud compute, model maintenance, and quarterly survey integration. It does not include the additional benefit from strip ratio optimisation, which typically adds another 8–12% to the total financial impact on operations where dilution has been a chronic problem.
ROI Calculator
Adjust the sliders to match your operation. Results update in real time.
Assumes: 12% ore recovery improvement on current loss rate, $150,000/year running cost, $1,200,000 base project cost plus $50,000 per Mt for data integration at scale. Excludes strip ratio optimisation benefits, which typically add 8–12% to total impact.
Ore Recovery Rate (% of design) — Moolarben Processing Plant
2024: manual planning baseline. 2025: digital twin deployed in Q1, model calibrating against actual blast outcomes. By Q3 recovery rate is trending consistently above 93%.
The ramp-up pattern in the chart reflects something important to understand before you present this to a board: the model gets more accurate over time, not immediately. In the first two quarters, the twin is learning your ore body's specific behaviour — how different geological zones respond to different drill patterns, how the plant actually processes different fragmentation profiles. The full 12% improvement is a 12-month outcome, not a quarter-one outcome. Planning presentations that show full savings from month one are projecting something the technology can't deliver that fast.
4. How the System Works
The diagram below shows the full data flow from mine inputs through the twin engine to planning outputs. What follows explains each layer in plain terms.
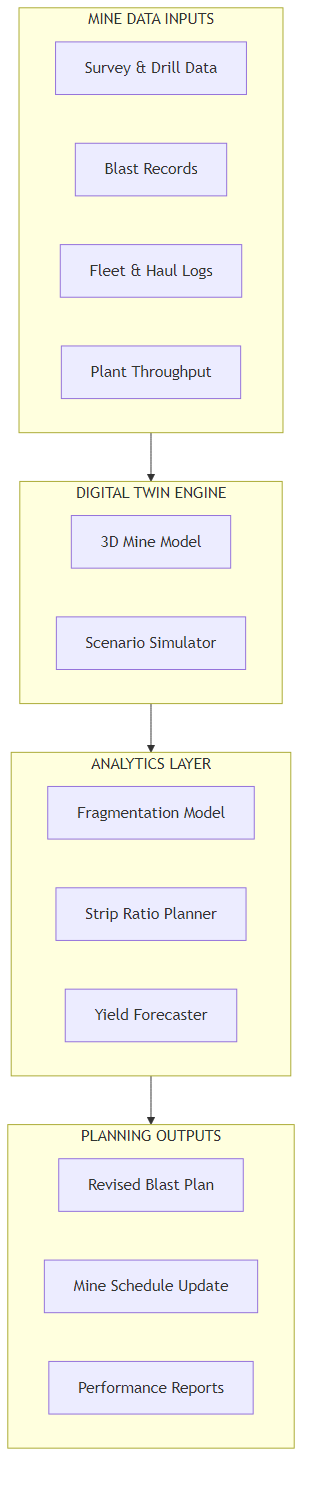

Six Layers, Plain English
Layer 1 — Survey and geological inputs. The foundation of the twin is a current 3D model of the pit: bench levels, ore zones, waste zones, and geological boundaries from the most recent survey. This model is updated on a rolling basis — typically after each survey campaign (quarterly on most Australian operations). The twin also ingests geological drill data — the assay results that tell you what's in each block before it's blasted.
Layer 2 — Historical blast records. The twin learns from what has already happened at your site. Every blast in the historical record — drill pattern, explosive type, timing sequence, actual fragmentation outcome, and the resulting crusher feed performance — is used to calibrate the fragmentation model. The more complete this record, the more site-specific the predictions become. An operation with 3 years of well-captured blast records will have a significantly more accurate twin than one with 18 months of incomplete data.
Layer 3 — Fleet and haul data. Truck cycle times, load factors, and haul road conditions connect the blast outcome to the plant feed rate. The twin uses this data to model how a given blast's muck pile geometry will affect dig cycle times and the smoothness of ore delivery to the crusher. A blast that produces excellent fragmentation but an irregular muck pile can still cause throughput variability — the twin captures this linkage.
Layer 4 — The 3D mine model and scenario simulator. This is the twin itself: a virtual replica of the pit that can be manipulated. Planning engineers propose a drill pattern and explosive configuration, and the simulator runs it through the fragmentation model to predict: average fragment size (P80), size distribution (the spread from finest to coarsest), muck pile profile, and estimated ROM quality. Multiple scenarios can be run in parallel — comparing a contractor's proposed pattern against two engineer-modified alternatives — and the outputs compared side by side.
Layer 5 — Analytics: strip ratio planner and yield forecaster. A separate analytics layer sits above the simulator and connects individual blast outcomes to the broader production plan. The strip ratio planner tests different mining sequence options to find the path that minimises waste tonnes moved per tonne of ore recovered over a 3–6 month planning horizon. The yield forecaster projects how today's planning decisions will affect the plant's throughput rate 4–8 weeks out, giving the plant manager earlier visibility of what's coming through the feed.
Layer 6 — Planning outputs. The twin produces three categories of output. First, a revised blast plan: the recommended drill pattern with the specific modifications the simulation suggests, ready for the engineer to review and approve. Second, a mine schedule update: if the simulation identifies a significant yield improvement opportunity from a sequencing change, the planning system is updated automatically. Third, performance reports: a monthly summary of simulation accuracy versus actual outcomes, which is what drives continuous model improvement and gives operations managers the evidence they need for capital planning reviews.
5. How the AI Finds Yield That Manual Planning Misses
The most common scepticism I encounter from experienced mine planners is this: "We already have a geological block model and we run fragmentation calculations manually. What does the twin add?"
The answer is interaction effects. A manual fragmentation calculation can estimate the average performance of a given drill pattern against a geological zone. What it can't easily capture is how the interaction between three adjacent geological zones — each with slightly different rock mass properties — affects the fragmentation at the boundaries between them. It also can't quickly test how changing the burden in one zone affects the confinement in the adjacent zone and the resulting muck pile geometry. These are exactly the planning decisions where experienced engineers make good intuitive calls — and also where they occasionally commit to patterns that underperform for reasons that weren't visible before the blast.
Why the Block Model Alone Isn't Enough
The geological block model tells you what's in the ground — ore grades, rock type classifications, and structural boundaries. What it doesn't model is how the rock will behave when energy is applied to it at a specific pattern and timing sequence. Fragmentation is a dynamic event, not a static geological property. Two zones with identical block model classifications can produce significantly different fragmentation outcomes depending on in-situ stress, moisture content, and jointing orientation — none of which appear in a standard block model but all of which the digital twin incorporates through calibration against actual blast outcomes.
The twin doesn't replace the block model. It builds on top of it, adding the behavioural layer that the geological model alone can't provide.
How the Model Calibrates Over Time
After each blast, the actual outcome — fragmentation survey results, crusher feed quality, muck pile survey — is fed back into the model. The twin compares its prediction to what actually happened and adjusts its internal parameters for that geological zone. An operation running 60 blasts per quarter generates 60 calibration data points every 3 months. By month 9–12, the model has seen enough variation to make predictions that are consistently within 8–10% of actual outcomes on fragmentation and within 5% on crusher throughput impact.
The number that surprises most planners: the model is usually most accurate on the geological zones that are most variable and hardest to predict manually — the transition zones between different rock types, the sections with higher moisture, and the areas with structural complexity. These are exactly the zones where manual planning most frequently underperforms. The twin finds value precisely where the human planning process is most uncertain.
6. What It Costs to Build and Run
Digital twin costs split clearly into one-time project costs and ongoing running costs. I'll cover both separately because they're approved through different processes and involve different budget owners.
Ongoing Running Costs (Annual)
| Component | What It Does | Approx. Annual Cost (AUD) |
|---|---|---|
| Cloud compute and storage | Runs simulations, stores geological data, blast records, and historical calibration data | $35,000–$55,000 |
| Model maintenance and recalibration | Quarterly recalibration against actual blast outcomes; geological model updates after each survey | $55,000–$80,000 |
| Survey data integration | Processing and integrating each quarterly survey update into the 3D model | $20,000–$35,000 |
| Planning software licences | Simulation platform and analytics dashboards for planning team | $18,000–$30,000 |
| Total annual running cost | For a 5Mtpa operation | ~$128,000–$200,000/year |
One-Time Project Costs
| Component | Cost Range (AUD) | Notes |
|---|---|---|
| Initial 3D mine model build | $150,000–$280,000 | Depends on pit complexity, existing survey quality, and historical data availability |
| Historical data audit and preparation | $40,000–$80,000 | Cleaning and structuring blast records, fragmentation records, and plant throughput data for model training |
| Fragmentation and yield model build | $180,000–$320,000 | Core AI model training and calibration against historical blast outcomes; most complex component |
| Planning system integration | $60,000–$120,000 | Connection to existing mine planning software (Deswik, Surpac, or equivalent) and plant information system |
| Training and workflow change | $30,000–$55,000 | Planning team training, workflow documentation, and 3-month handover with vendor support |
| Total project (5Mtpa operation) | $460,000–$855,000 | Wider range driven by data quality — operations with complete, structured historical records cost significantly less |
The Number That Surprises Most People
The fragmentation AI model is not the expensive part — it's the data preparation work that precedes it. Operations that have captured blast records, fragmentation outcomes, and crusher feed performance in a structured format pay $40,000–$80,000 for data prep. Operations that haven't — where records are in spreadsheets, shift reports, or paper logs — can spend $150,000–$250,000 just making the historical data usable. Audit your blast record quality before you budget for the twin itself. Be sceptical of any vendor who doesn't ask to see your historical records before quoting.
Where Your Annual Yield Loss Currently Comes From
The red slice — suboptimal blasting and fragmentation — is the primary target. The digital twin addresses this directly; strip ratio and processing efficiency improvements follow.
7. What Your Team Needs to Make This Work
Here's what I've seen derail otherwise sound projects. The data infrastructure and modelling work are technical but manageable. The workflow change — getting planners to use the twin outputs in their actual decision-making — is where most deployments succeed or fail.
The Internal Team You Need
- A mine planning engineer with authority to change blast parameters. The twin produces recommendations; a qualified engineer needs to review and approve them. This isn't a new role — it's your existing planning engineer with a better tool. They need 3–4 hours per week dedicated to running simulations and reviewing outputs, not just receiving them from the vendor.
- A data owner for blast records and survey data. Someone whose job it is to ensure that actual blast outcomes are captured and fed back into the model within 72 hours of each blast. This is typically a survey technician or planning coordinator. The model calibration quality depends entirely on the completeness of this feedback loop.
- Plant management awareness of the throughput forecasts. The twin's yield forecaster generates 4–8 week throughput projections for the plant. If the plant manager isn't receiving and acting on those forecasts — adjusting feed rates, scheduling maintenance windows — half the value of the system goes unrealised. This is an information flow change, not a technology deployment.
Build vs. Buy
The 3D model build, fragmentation AI training, and planning system integration are specialist work that most mine planning teams don't have in-house. The failure mode of attempting to build in-house is almost always that the model gets built, performs reasonably on the training data, and then slowly drifts from reality as the pit evolves — because the quarterly recalibration discipline wasn't maintained without vendor support. A managed service contract that includes quarterly recalibration is almost always the right structure.
What you should keep internal: the planning decisions themselves. The twin gives your planner a better prediction; it doesn't make the call. Your engineer's understanding of site-specific conditions — the anomalous zone in the eastern wall, the seasonal moisture pattern that affects the crusher feed in Q3 — is what turns a model output into a decision you can trust. The vendor builds the engine; your planner drives it.
Realistic Timeline
| Phase | Timeline | What Happens |
|---|---|---|
| Data audit and preparation | Weeks 1–6 | Historical blast records, fragmentation data, and survey data reviewed and structured for model training; gaps identified and filled where possible |
| Initial 3D model build | Weeks 4–12 | Current pit model built from most recent survey data; geological boundaries and ore zones mapped |
| Fragmentation model training | Weeks 10–20 | AI model trained on historical blast-to-outcome data; initial calibration against known events; prediction accuracy benchmarked |
| Planning integration and pilot | Weeks 16–24 | First live simulations run alongside the existing manual planning process; predictions compared to actual outcomes; workflow adjusted |
| Full planning handover | Months 6–9 | Twin becomes the primary planning tool; manual process runs in parallel for verification for first 3 months before being retired |
| Steady-state accuracy | Month 9–15 | Model has 4+ quarters of calibration data; predictions within 8–10% of actual fragmentation outcomes consistently; full 12% yield improvement realised |

8. How You Know the System Is Working
The KPIs for a digital twin are operational outcomes — what actually happened in the pit and the plant — not system metrics. These belong in your weekly production meeting, not an IT review.
| Metric | What to Track | Target (12 months in) |
|---|---|---|
| Ore recovery rate | Monthly ore recovered as % of geological block model estimate for each blast area | 10–12% improvement vs pre-deployment baseline |
| Prediction accuracy | Simulation P80 fragmentation vs actual P80 measured post-blast | Within 10% on 85% of blasts by month 9 |
| Crusher throughput vs design | Monthly actual throughput as % of design capacity | Trending above 92% consistently; eliminating the sub-75% quarters |
| Strip ratio | Waste tonnes moved per tonne of ore recovered, quarterly average | 15% reduction vs pre-deployment baseline |
| Planning cycle time | Average hours from pattern submission to approved blast plan | Under 6 hours for standard cuts; baseline typically 24–48 hours |
The prediction accuracy metric deserves particular attention in months 3–6. If the model's fragmentation predictions are diverging from actual outcomes by more than 20% consistently, it means the calibration data isn't being fed back correctly, the geological model needs a survey update, or the model was trained on an unrepresentative sample of historical blasts. Each of these is diagnosable and fixable — but only if you're tracking the accuracy gap actively rather than assuming the predictions are correct.
9. Where to Start
If the ROI calculator showed a compelling case for your operation, and your site fits the profile in Section 1, here is the sequence that gives you the fastest path to a working, accurate model:
- Audit your historical blast records before any other step. Pull 24 months of blast data and assess what's actually captured — drill pattern, explosive type, actual fragmentation outcome, crusher feed quality. This audit tells you the real project cost and timeline before you brief a vendor. If the records are incomplete, the data remediation work defines the project scope more than the AI model does.
- Confirm your survey currency and refresh schedule. If your current 3D geological model is more than 6 months old, schedule a survey before the twin project begins. Building a model on stale survey data and then wondering why the predictions don't match reality is a known and avoidable failure mode.
- Start with one processing circuit or one bench, not the whole operation. A digital twin built on one processing plant and the blast areas that feed it is a working system in 4–5 months. A full site twin takes 12–18 months and costs 3–4 times as much. Prove the value on a contained scope before expanding.
- Assign the blast data capture role before the project starts. Identify the person responsible for recording actual fragmentation outcomes — size distribution surveys, muck pile profiles, crusher feed quality readings — and ensure that role has time allocated and clear accountability before the twin goes live. Model calibration quality is 100% dependent on this.
- Build prediction accuracy into your vendor contract. Specify that the fragmentation model must achieve within 12% accuracy on 80% of blasts within 9 months of full deployment, with a defined recalibration process if that target is missed. This holds the vendor accountable for model quality, not just software delivery.
Key Takeaways
The Decisions This Article Is Designed to Help You Make
- Is the opportunity real for your operation? Use Section 1's checklist and the ROI calculator. If your annual ore recovery loss is above $3M and your blast record quality is reasonable, the business case almost always closes within 24 months.
- What are you actually buying? A system that lets your planning engineer test a drill pattern in a virtual mine before a single hole is drilled — with a prediction of fragmentation, muck pile geometry, and crusher throughput impact accurate enough to make a different decision when the simulation flags a risk.
- What does it cost? $460,000–$855,000 one-time project cost for a 5Mtpa operation, $128,000–$200,000 per year to run. Data preparation is where the cost surprise lives, not the AI model itself.
- How long does it take? First live simulations in 4–5 months. Full accuracy and the complete 12% improvement: 9–15 months, depending on how quickly the model calibrates against actual blast outcomes.
- What can go wrong? A model that diverges from reality because blast outcome data isn't being captured and fed back. A planning team that reverts to manual methods when the twin's predictions don't match their intuition (the right response is to investigate, not to ignore). And a geological model that goes stale because survey updates weren't maintained. All three are process failures, not technology failures — and all three are preventable.
Want Practical Insights on AI in Operations?
I write about applying AI to real business problems — with honest numbers and no vendor speak. Subscribe for articles delivered twice a month.
Subscribe to Newsletter →