What This Article Covers
- When AI scheduling is and isn't worth the investment for your construction operation
- What a scheduler's week actually looks like before and after deployment
- A realistic business case — with a calculator you can adjust to your own program
- How the system works in plain language, without vendor pitch or jargon
- What it costs, what your team needs, and how to know it's working
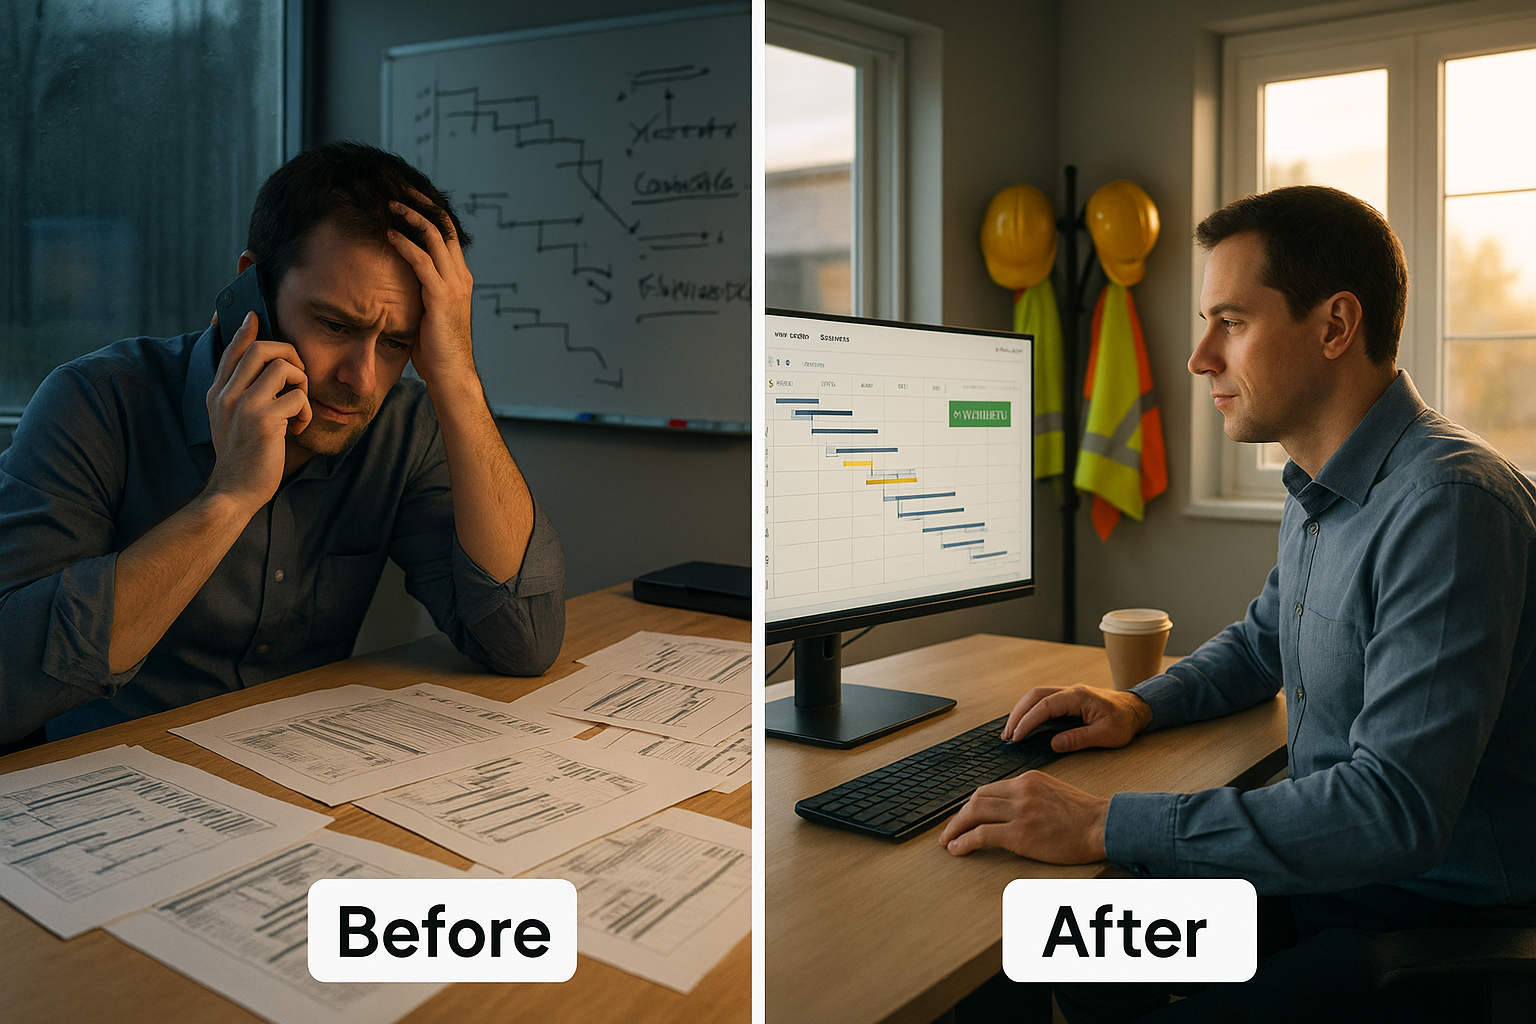
It's 6:15 AM on a Monday and the senior scheduler on a mid-size NSW infrastructure package is looking at yesterday's rain totals. Forty millimetres overnight, more forecast for Wednesday. She knows the concrete pour scheduled for Tuesday is now at risk, but she won't know how badly until she manually walks the Primavera schedule, checks which downstream trades depend on that pour, and calls the site engineer to confirm crew availability for a revised sequence. That analysis will take most of the morning. By the time the revised plan reaches the site team, two days of the response window are already gone.
Now run that same Monday on a program running AI-assisted scheduling. The system flagged the rain risk against the live schedule at 5 AM, simulated the effect on the concrete pour and every downstream activity, and had a validated reschedule option waiting in the scheduler's inbox before she'd finished her coffee. She reviews it, adjusts one sequencing assumption the model got slightly wrong, and approves it by 7 AM. The site team has the revised plan before the pre-start meeting.
This article is about how that shift happens — what it takes, what it costs, and when it's not worth attempting.
1. Is This Right for Your Operation?
I'll address this upfront, because too many construction firms invest in scheduling software before confirming the basics. The 30–40% delay reduction figure gets thrown around in every vendor deck. The question is whether it holds for your specific portfolio, your specific scheduling maturity, and your specific exposure to weather and supply chain risk.
This works well if your organisation:
- Runs three or more concurrent project packages worth $10M or more combined
- Already schedules in Primavera P6 or MS Project, with a maintained critical path
- Has experienced repeat critical-path slippage from weather, supply delays, or subcontractor availability in the last 12 months
- Has a dedicated planning or scheduling function — even one or two people counts
- Tracks schedule variance historically, even if only in spreadsheets — this becomes the model's training data
Walk away from this idea if:
- You're running a single package under $5M — the fixed implementation cost rarely pays back at that scale
- You don't have a structured baseline schedule in Primavera or MS Project — AI cannot reschedule what was never formally scheduled
- Your planning function sits entirely at head office with no feedback loop from site — the model needs site-level variance data to stay accurate
- Leadership won't act on AI-flagged replanning recommendations — a tool nobody acts on is a wasted licence fee
- Your projects are highly bespoke one-offs with no historical schedule data to train against — the model needs a pattern to learn from
Be sceptical of any vendor quoting the same delay-reduction number regardless of portfolio size. A head contractor running four concurrent packages with a mature Primavera environment sees a very different result to a subcontractor scheduling a single job in a spreadsheet. The numbers in this article are calibrated for mid-size to large NSW construction operations running multiple concurrent packages with an existing Primavera or MS Project environment.
2. What Changes Day-to-Day
Before: The Manual Replanning Cycle
A scheduler's week runs on lag. Weather forecasts, supply chain updates, and subcontractor availability changes all arrive as separate signals from separate sources — a forecast email, a supplier phone call, a text from a site foreman. None of them are automatically checked against the live critical path. When a disruption risk surfaces, the scheduler has to manually trace which activities are affected, estimate the knock-on impact on dependent trades, and draft a revised sequence by hand in Primavera or MS Project. On a multi-package portfolio, this analysis can take anywhere from half a day to three days depending on how many downstream dependencies are involved.
By the time a revised plan reaches the site team, the response window has often shrunk to almost nothing. A concrete pour that could have been resequenced with two days' notice instead gets cancelled the morning of, with idle crews and re-mobilisation costs to show for it.
After: The Review-and-Approve Workflow
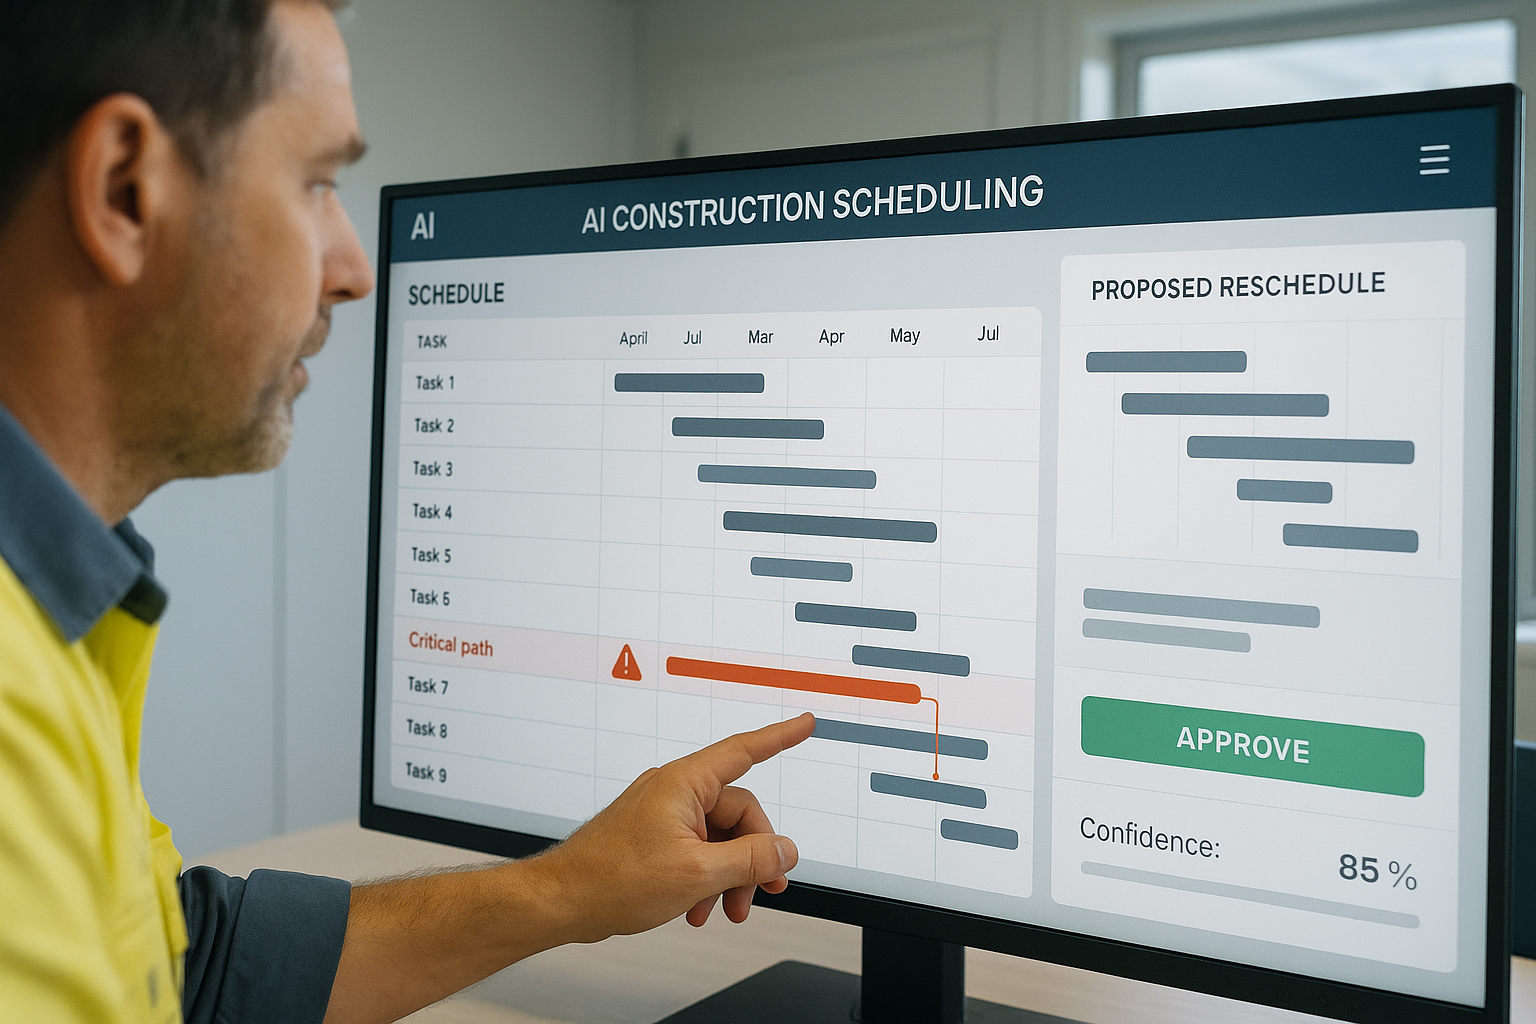
With AI scheduling in place, the system continuously checks live weather forecasts, supply chain signals, and subcontractor availability against the current Primavera or MS Project schedule. When it detects a developing risk to the critical path, it simulates the impact and drafts a validated reschedule option — not a generic warning, a specific proposed sequence change with the reasoning attached. The scheduler's job shifts from manually detecting and drafting to reviewing, adjusting where local knowledge says the model missed something, and approving.
The shift in mindset is from manually detecting risk to reviewing a drafted response. Your schedulers stop being data-entry clerks tracing dependencies by hand and start being the quality check on a system that's already done the tracing. That's a better use of their judgement — and it's what buys back the response window.
3. The Business Case
The number that surprises most operations directors isn't the delay reduction percentage — it's how quickly the labour and liquidated-damages exposure adds up when you actually count schedule delay incidents across a portfolio. A "delay incident" in this context is any disruption that forces a critical-path resequence: a weather event, a supply delay, a subcontractor availability gap. On a mid-size NSW portfolio running several concurrent packages, these aren't rare — most operations directors are surprised to find they're tracking a dozen or more a year once someone actually counts them.
Each incident carries a real cost: extended site overheads and preliminaries for the days lost, potential liquidated damages exposure if the program milestone is threatened, and the idle or re-mobilisation cost when a crew shows up to a cancelled activity. AI scheduling doesn't eliminate these events — weather and supply chains are still unpredictable — but catching them 24–72 hours earlier turns a costly cancellation into a manageable resequence.
ROI Calculator
Adjust the sliders to match your operation. Results update in real time.
Assumes a 35% reduction in delay-incident cost through earlier detection and faster resequencing. Excludes liquidated damages avoidance beyond the modelled incident cost, reputational value of on-time delivery, and subcontractor relationship benefits from fewer last-minute cancellations.
Critical-Path Schedule Slippage — Days Per Quarter, 4-Package Program
Q1–Q4 2025: manual scheduling baseline. Q1 2026: AI scheduling deployed mid-quarter with a partial-quarter ramp-up. Q2–Q4 2026: full AI-assisted rescheduling across all four packages. The ramp-up quarter is expected — plan your milestone commitments accordingly.
One important caveat: the full 35–40% reduction doesn't appear from week one. It ramps in over the first eight to twelve weeks as the model builds a pattern library from your actual schedule variance data and your schedulers build confidence in acting on its recommendations quickly rather than re-verifying everything by hand. Budget your ROI projections from month three, not month one.
4. How the System Works
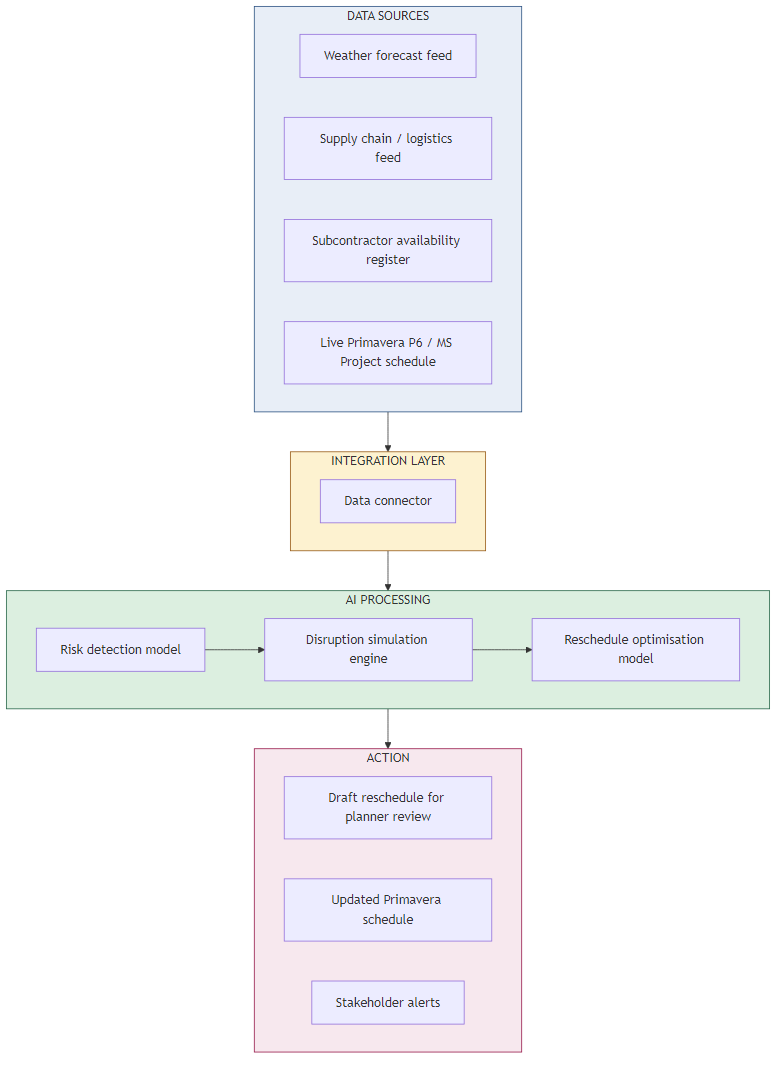
The system connects to your existing scheduling environment and follows six stages from raw signal to an approved, pushed-back schedule:
- Data Intake: The system ingests live weather forecasts, supply chain and logistics feeds, a subcontractor availability register, and your current Primavera P6 or MS Project schedule on a continuous basis.
- Risk Detection: A model trained on your historical schedule variance data flags activities on or near the critical path that are exposed to a developing risk — a forecast rain event over an outdoor pour, a flagged delay on a steel delivery, a subcontractor showing reduced crew availability.
- Disruption Simulation: For each flagged risk, the system simulates the knock-on effect across dependent activities, estimating the schedule impact if no action is taken.
- Reschedule Optimisation: The system generates one or more proposed resequencing options that minimise the impact on the overall program milestone, factoring in crew and equipment availability.
- Planner Review: The proposed reschedule reaches the scheduler with the reasoning attached — which risk triggered it, which activities are affected, and what changed. The scheduler adjusts for local knowledge the model doesn't have and approves or rejects.
- Schedule Push-Back and Alerts: Once approved, the revised sequence is written back to Primavera or MS Project, and affected site teams and subcontractors receive an automated alert with the updated plan.
5. How the AI Reschedules Around Risk
Here's an analogy that's closer to the truth than most vendor explanations. Picture a scheduler who has run forty programs over twenty years and has an instinct for which activities are fragile — which trade combinations tend to cascade badly when one slips, which suppliers run late in wet season, which crews can absorb a resequence without losing momentum. That instinct is the difference between a scheduler who reacts to disruption and one who anticipates it. The AI is building that same pattern library — but from your program's actual historical schedule variance data, not from one person's memory that leaves with them when they change employers.
Why Fixed Contingency Buffers Don't Solve This
Most construction schedules already carry contingency — a flat percentage of float padded onto weather-exposed or supply-dependent activities. The problem is that a fixed buffer is either wasted on activities that turn out to be low-risk, or insufficient for the ones that turn out to be genuinely volatile. It's a blunt instrument applied uniformly regardless of the actual risk signal on any given week.
An AI model trained on your schedule history allocates buffer dynamically, based on the live risk signal for that specific activity in that specific week — not a flat rule applied to every outdoor pour regardless of the forecast. When a supplier's delivery reliability quietly degrades over a few months (as it does, regularly, without anyone formally flagging it), the model picks up the pattern in the variance data and adjusts its risk weighting — without a planner having to notice and manually re-pad the schedule.
The simulation component is what separates this from a simple alerting tool. A basic weather-alert system tells you rain is coming. It doesn't tell you which of your forty active schedule activities that rain actually threatens, how many trades are waiting on the affected activity, or what the least-disruptive resequence looks like. That translation from raw signal to a specific, actionable schedule change is where the real time saving happens — and it's the step most schedulers currently do by hand, under time pressure, activity by activity.
6. What It Costs
I'll give you the real numbers, including the ones most vendor quotes leave out until you're deep into contract negotiation.
| Running Cost Item | Monthly Cost (AUD) | Notes |
|---|---|---|
| AI scheduling SaaS licence | $2,800 – $4,200 | Scales with number of active packages under management |
| Primavera / MS Project integration maintenance | $600 – $1,000 | Vendor or internal IT time to maintain the schedule data connection |
| Weather & supply-chain data feed subscriptions | $300 – $600 | Commercial-grade forecast and logistics data — free tiers aren't accurate enough |
| Internal planning oversight | $1,800 – $2,600 | ~0.2 FTE scheduling lead time for monitoring and model feedback |
| Total monthly running cost | $5,500 – $8,400 | $66,000 – $100,800 per year |
| One-Time Project Cost | Cost Range (AUD) | Notes |
|---|---|---|
| Vendor implementation & Primavera/MS Project integration | $35,000 – $60,000 | Schedule data connection, portfolio configuration, initial model setup |
| Historical schedule data migration & model training | $15,000 – $28,000 | Cleaning and structuring past baseline and actual schedule data for training |
| Planner training & change management | $6,000 – $12,000 | Scheduler and site PM training, workflow documentation |
| Single-package pilot (8-week) | $6,000 – $10,000 | Testing before full-portfolio rollout |
| Total one-time project cost | $62,000 – $110,000 | Median for a mid-size, multi-package NSW operation: ~$85,000 |
The Number That Surprises Most Organisations
Vendor quotes almost always lead with the platform licence. What they don't lead with is the historical schedule data cleanup cost — if your Primavera baselines and actual dates aren't consistently logged across past programs, the model training step balloons well past the estimate, because someone has to reconstruct the variance history manually before the model has anything reliable to learn from.
The second hidden cost is the weather and supply-chain data feed subscription. Many head contractors assume a free public weather API is good enough; it isn't for activity-level risk detection, and the commercial-grade feeds vendors actually rely on carry a real, ongoing subscription cost that's easy to miss in an initial quote.
Where Your Current Schedule Risk Cost Goes
The red slice is the primary target. AI shifts spend from extended overheads and idle crew costs toward planning oversight and exception handling.
7. What Your Team Needs
Here's what I've seen derail otherwise sound projects: the assumption that the vendor handles everything and your schedulers just show up for a training session. That's not how it works. A successful deployment needs three internal roles — none full-time, but all present and accountable.
Scheduling Lead (0.3–0.5 FTE): Owns the Primavera or MS Project data connection, coordinates with the vendor during integration, and monitors the model's recommendations for accuracy post-deployment. This person needs to understand your schedule structure deeply — they don't need to understand the AI itself.
Site Champion (0.2 FTE from existing staff): A senior project manager or site engineer who validates the system's proposed reschedules during the pilot and becomes the first point of contact when site teams have questions about a flagged risk. Staff trust a system faster when a respected colleague has vouched for it.
Executive Sponsor (Program Director or COO): Someone who has approved the project, can remove blockers during implementation, and holds the organisation accountable to actually acting on the AI-flagged reschedules post-deployment. Without this, projects stall the first time a reschedule recommendation is quietly ignored.
On build versus buy: buy. The weather and logistics data feed maintenance, the ongoing model retraining, and the Primavera/MS Project API integration make a custom build impractical for any construction firm without a dedicated data engineering function. Evaluate vendors on two criteria above all others: their track record integrating with your specific scheduling platform, and whether their disruption simulation has been validated against real project outcomes, not just a demo dataset.
| Phase | Weeks | Key Activities | Who Leads |
|---|---|---|---|
| 1. Discovery & Scoping | 1–4 | Audit portfolio, historical delay incidents, and schedule data quality; confirm Primavera/MS Project compatibility; select vendor | Executive Sponsor + Scheduling Lead |
| 2. Schedule Data Integration | 5–9 | Connect live schedule feed; map weather and supply-chain data sources; clean historical variance data | Scheduling Lead + Vendor PM |
| 3. Model Training & Pilot | 10–17 | Train model on 12–18 months of historical schedule variance; run 8-week pilot on one package; measure accuracy against real disruptions | Site Champion + Vendor |
| 4. Planner Training | 16–18 | Train all schedulers on the review-and-approve workflow; update planning SOPs | Site Champion |
| 5. Full Portfolio Rollout | 19–24 | Extend to all active packages; move from supervised to standard review workflow | Scheduling Lead + Site Champion |
| 6. Optimisation & Review | 25–30 | Review KPIs against targets; refine risk thresholds; add packages as new programs mobilise | Executive Sponsor + Scheduling Lead |

8. How You Know It's Working
Set these five metrics as your baseline before deployment and measure them monthly. If you don't have baseline numbers, spend four weeks collecting them manually before go-live — you cannot demonstrate ROI without a before figure.
| Metric | Baseline (Typical) | 12-Month Target | How to Measure |
|---|---|---|---|
| Critical-path schedule variance | 18–25 days per quarter | <8 days per quarter | Primavera/MS Project variance report, portfolio-wide |
| % of disruptions flagged before impact | 15–20% | >70% | Disruptions caught pre-emptively ÷ total disruptions logged |
| Time to produce a validated reschedule | 1–3 days | <8 hours | Timestamp from risk detection to scheduler approval |
| Delay-incident cost per quarter | $250,000–$400,000 | <$160,000 | Extended overheads + idle crew cost + LD exposure, logged per incident |
| Scheduler hours on manual replanning per month | 40–60 hours | <15 hours | Timesheet allocation for replanning activity |
In practice, the right setting for most portfolios is to treat the 12-month target as a floor, not a ceiling. The best-performing operations hit these numbers by month eight and then look at extending the same risk-detection approach to subcontractor procurement lead times, which follows naturally from the same data infrastructure.
9. Where to Start
If the numbers in Section 3 are compelling and you've confirmed the basics in Section 1, here are five concrete actions to take in the next 30 days:
- Run a four-week delay-incident audit. Count schedule delay incidents across your active portfolio over the last 12 months, estimate the cost of each using extended overheads and idle crew cost, and identify which packages carry the most weather or supply-chain exposure. These numbers are your baseline.
- Pull 12–18 months of schedule history. Work with your planning team to extract baseline and actual dates from Primavera or MS Project for completed and in-flight packages, including variance notes where available. This is what the model trains on — operations that can't produce it aren't ready.
- Confirm your Primavera/MS Project API access. Ask your IT team or scheduling software vendor whether your environment supports a standard integration API. If not, budget the custom integration cost before approaching an AI vendor.
- Run a vendor sandbox session on one live package. Before committing to any platform, give vendors five real historical disruption events from your own schedule history and ask them to show what the system would have recommended. Compare it against what actually happened.
- Design an 8-week pilot on your highest-risk package. Pick the package with the most weather or supply-chain exposure and the most mature Primavera data. Run the AI system in parallel with manual scheduling for eight weeks before handing over any live rescheduling decisions.
Key Takeaways
- Is the opportunity real? Yes — if you're running three or more concurrent packages and experiencing repeat critical-path slippage, the labour and delay-cost savings typically close a business case within five to seven months.
- Is it the right time? Only if you have a maintained Primavera or MS Project baseline, a scheduling function that can own the data connection, and leadership that will actually act on the recommendations.
- What's the realistic saving? Use the calculator above with your numbers. A four-package portfolio with a dozen delay incidents a year at $85,000 average cost sees roughly $300,000–$360,000 in annual savings against an $85,000–$110,000 implementation cost.
- What's the honest risk? A deployment nobody acts on costs as much as one that works — the difference is whether your schedulers trust and use the recommendations. Firms that appoint a site champion and enforce the review workflow see results. Firms that treat it as a plug-and-play software licence do not.
- Where to start? Four-week delay-incident audit first. No vendor conversation before you have your incident count, average cost, and schedule history ready.
Want Practical Insights on AI in Operations?
I write about applying AI to real business problems — with honest numbers and no vendor speak. Subscribe for articles delivered twice a month.
Subscribe to Newsletter →