What This Article Covers
- When AI site monitoring is and isn't worth the investment for your operation
- What a site manager's week actually looks like before and after deployment
- A realistic business case — with a calculator you can adjust to your own site
- How the system works in plain language, without vendor pitch or jargon
- What it costs, what your team needs, and how to know it's working
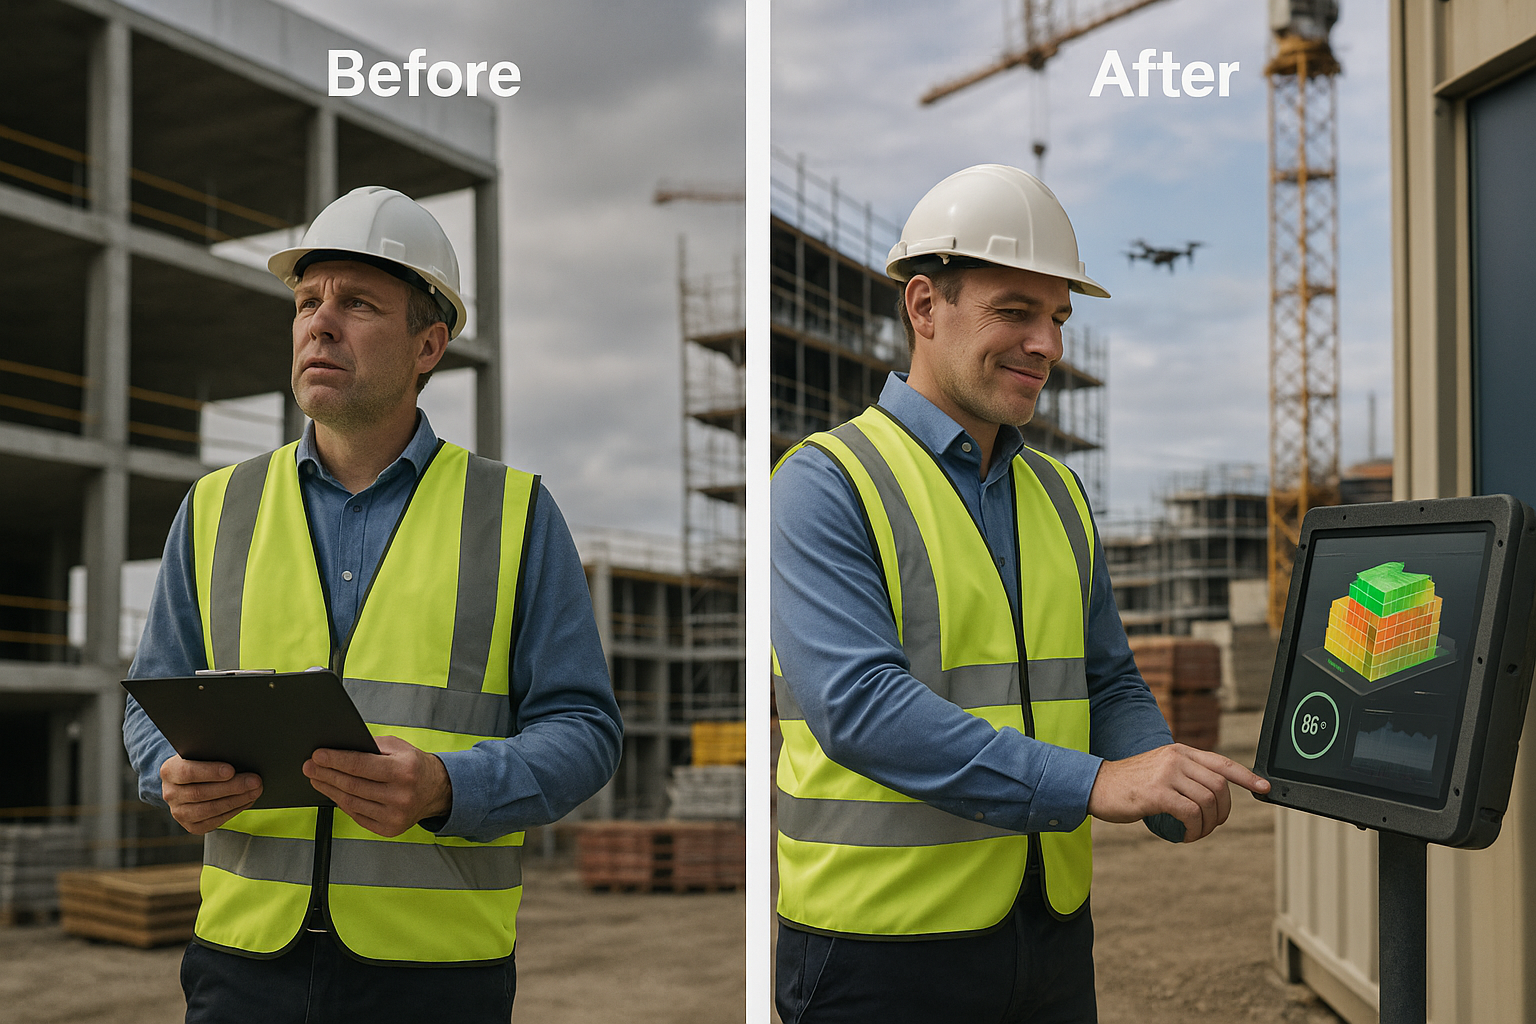
It's Friday afternoon on a mid-size NSW commercial build, and the site manager is compiling the fortnightly progress claim. He walks the site with a clipboard, eyeballs how much of the slab has been poured against the program, and cross-checks it against what the site engineer told him on Tuesday. The number he submits is his best estimate — reasonably close, but never exact, because nobody has physically measured every element against the design model. Meanwhile, a pallet of copper fittings that was delivered ten days ago is nowhere to be found, and nobody can say for certain when it went missing.
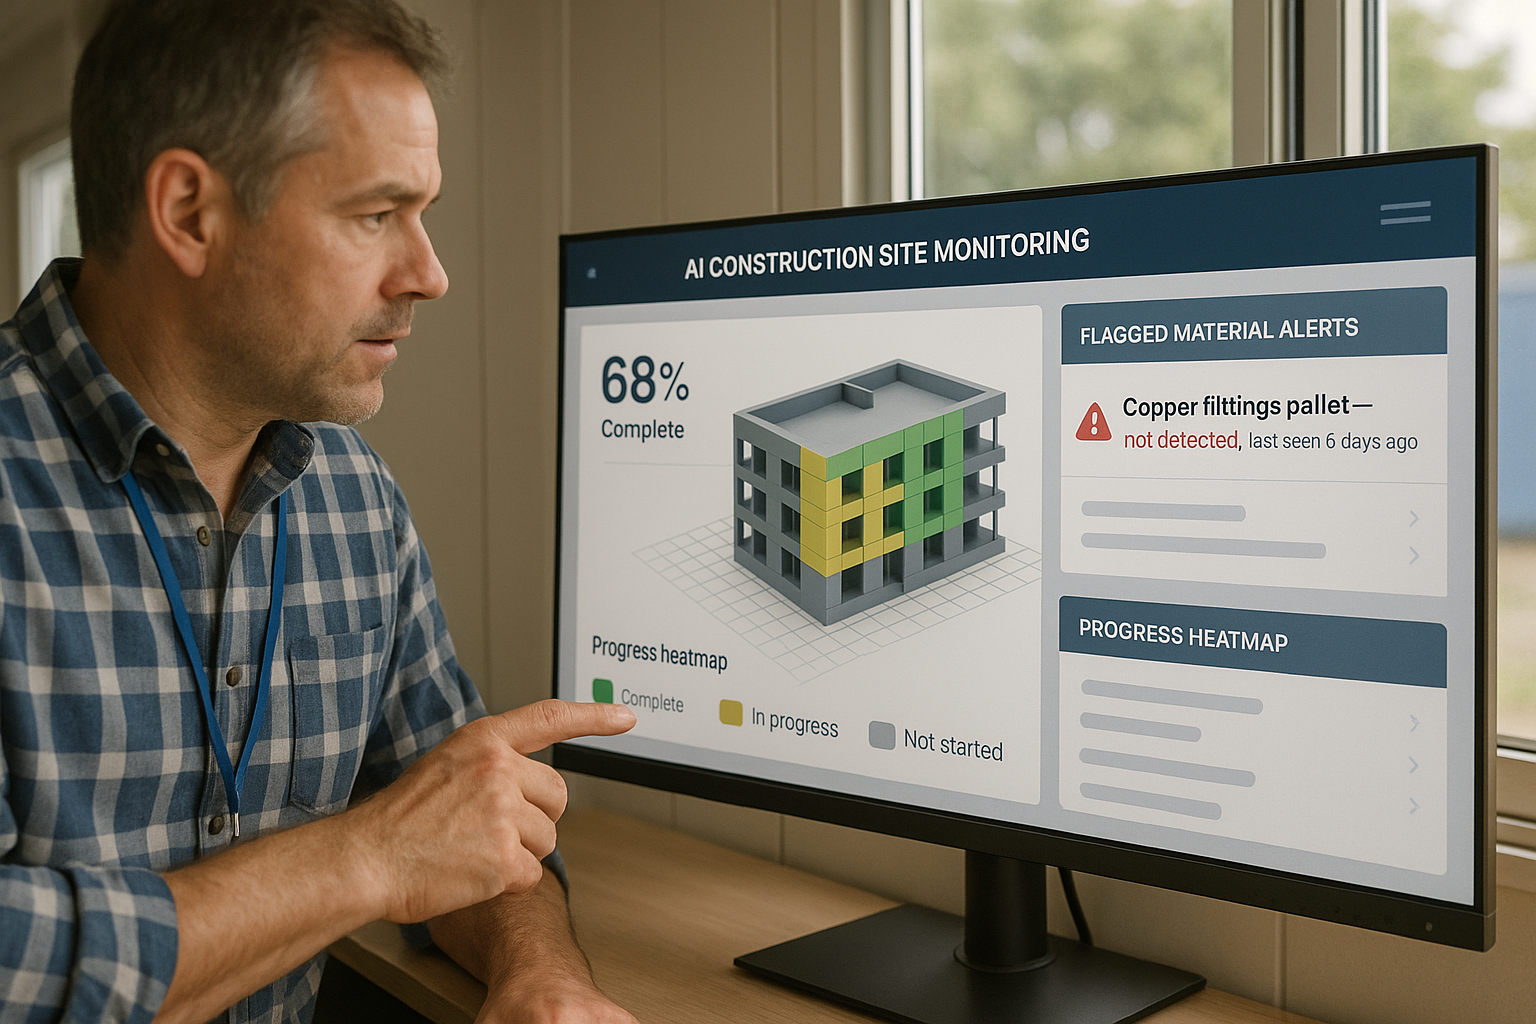
Now picture the same Friday on a site running AI-assisted monitoring. A drone flyover on Wednesday captured the entire site in fifteen minutes. By Thursday morning, the system had compared the point cloud against the BIM model and produced an element-by-element percent-complete figure, accurate enough to defend in a progress claim meeting without a site walk. It also flagged that the copper fittings pallet, tracked since delivery, hadn't moved from its logged position in six days — then disappeared from the Tuesday scan entirely, giving the site manager a two-day window to review gate footage instead of a shrug.
This article is about how that shift happens — what it takes, what it costs, and when it's not worth attempting.
1. Is This Right for Your Operation?
I'll address this upfront, because too many construction firms buy a drone and call it done before confirming the basics. The 25% progress-accuracy improvement figure gets thrown around in every vendor deck. The question is whether it holds for your specific site type, your BIM maturity, and your exposure to material or plant loss.
This works well if your organisation:
- Runs sites with a maintained 3D BIM model — the system needs a design baseline to compare progress against
- Manages projects worth $8M or more, where a single inaccurate progress claim carries real cash-flow consequences
- Has experienced material shrinkage, plant misplacement, or theft in the last 12 months worth chasing up
- Has at least one open, accessible site perimeter suitable for regular drone flyovers
- Already produces some form of periodic progress report — even a spreadsheet — that this can replace or validate
Walk away from this idea if:
- Your project is under $5M — the fixed setup cost rarely pays back at that scale
- You don't have a BIM model, or your design documentation is 2D drawings only — there's nothing for the AI to measure progress against
- Your site is a tight urban infill with no legal or safe drone flight path — fixed cameras alone won't deliver the full accuracy gain
- Your client or head contractor won't accept AI-generated progress figures as claim evidence — the output has nowhere to go
- You're running a single short-duration fit-out under three months — the setup time won't be recovered before practical completion
Be sceptical of any vendor quoting the same 25% figure regardless of BIM maturity. A head contractor with a fully coordinated federated BIM model sees a very different result to one running a partial architectural model with no structural or services detail. The numbers in this article are calibrated for mid-size to large NSW commercial and infrastructure sites with an existing BIM environment and a formal progress-claim process.
2. What Changes Day-to-Day
Before: The Manual Walk-and-Estimate Cycle
Progress tracking on most sites still runs on a physical walk. A site manager or foreman spends a half-day to a full day every one to two weeks walking the site, comparing what's built against the program in their head, and translating that impression into a percent-complete figure for the progress claim. Material and plant tracking runs on the same informal basis — someone notices something is missing, usually days or weeks after it actually went, and by then there's no footage or log trail left to chase.
The problem isn't laziness — it's that a human eye, no matter how experienced, is estimating volume and area from a ground-level view. On a multi-storey structure or a site with significant underground or services work, entire completed elements are invisible from the walking path. The resulting progress figure is directionally right and numerically soft, which becomes a real problem the moment a client or financier questions a claim.
After: The Review-and-Validate Workflow
With AI site monitoring in place, a drone flyover or fixed-camera capture runs on a set schedule — typically weekly — and the system automatically compares the captured point cloud against the BIM model, element by element, to produce a percent-complete figure with a defensible audit trail. Tagged materials and plant are tracked against their last known position on every capture, and the system flags anything that has gone missing or moved outside its expected zone. The site manager's job shifts from walking and estimating to reviewing the flagged variances and validating the figure before it goes into the claim.
The shift in mindset is from eyeballing progress to auditing a measurement. Your site managers stop being the primary data source for "how much is actually built" and start being the quality check on a system that measured it directly against the design. That's a better use of their time — and it's what makes a progress claim defensible under scrutiny.
3. The Business Case
The number that surprises most operations directors isn't the progress-accuracy percentage — it's how much unrecovered value sits in inaccurate claims and unlogged material loss once someone actually adds it up. On a mid-size NSW site, material and plant shrinkage typically runs 1–2% of total project value — a figure most operations directors have heard quoted but never actually reconciled against their own site.
Inaccurate progress claims carry a subtler but larger cost: under-claiming delays cash flow, and over-claiming that gets challenged by a superintendent or financier costs credibility and negotiating leverage on the next milestone. AI site monitoring doesn't eliminate theft or claim disputes — a determined thief will always find a gap, and clients will always scrutinise big claims — but a defensible, element-level progress figure and a two-day detection window on missing materials turn both problems from open-ended risk into a manageable, bounded cost.
ROI Calculator
Adjust the sliders to match your operation. Results update in real time.
Assumes a 55% reduction in material shrinkage and claim-variance cost through weekly AI-validated progress and material tracking. Excludes cash-flow value of faster claim cycles, dispute-avoidance value, and insurance premium effects of a documented theft-deterrence system.
Progress Claim Variance — % Points Off Actual, Per Quarter
Q1–Q4 2025: manual walk-and-estimate baseline. Q1 2026: drone and IoT monitoring deployed mid-quarter with a partial-quarter ramp-up. Q2–Q4 2026: full weekly AI-validated progress tracking. The ramp-up quarter is expected — plan your claim milestones accordingly.
One important caveat: the full accuracy gain doesn't appear from week one. It ramps in over the first six to ten weeks as the BIM model is fully calibrated against as-built conditions and the material-tagging register reaches useful coverage. Budget your ROI projections from month two, not month one.
4. How the System Works
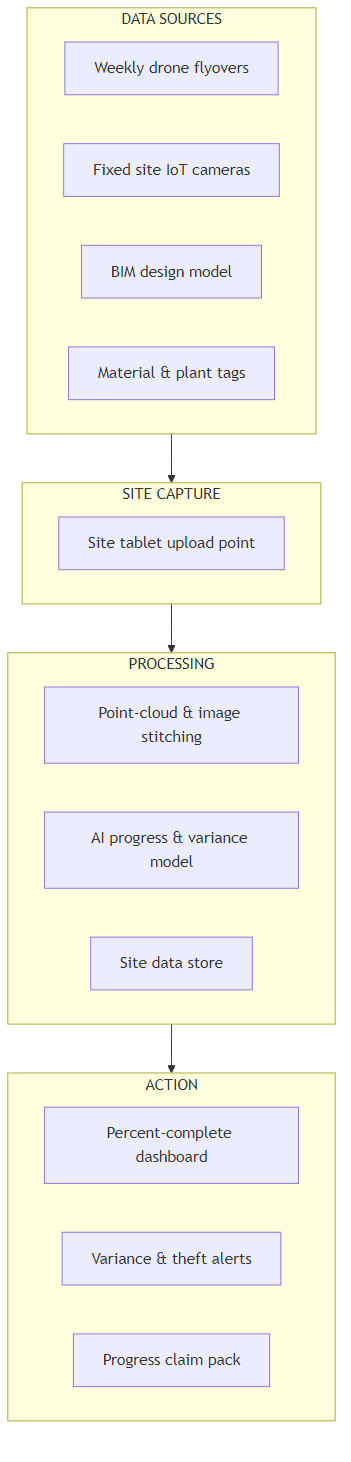
The system connects to your existing BIM environment and follows six stages from raw capture to a validated claim figure:
- Site Capture: A drone flyover (typically weekly) or fixed IoT cameras capture the site from multiple angles, along with RFID or barcode reads from tagged materials and plant.
- Data Upload: Captured imagery and tag reads are uploaded from a site tablet or automatically synced from the drone's onboard storage once it lands.
- Point-Cloud Reconstruction: The system stitches the captured imagery into a 3D point cloud representing the current as-built state of the site.
- AI Progress & Variance Comparison: The point cloud is compared element by element against the BIM design model, producing a percent-complete figure and flagging any tagged material or plant that has moved, disappeared, or sat stationary longer than expected.
- Site Manager Review: The percent-complete figure and any flagged variances reach the site manager with the underlying imagery attached — which element changed, what the model measured, and why a material flag was raised. The site manager validates or adjusts before sign-off.
- Dashboard and Claim Pack Output: Once validated, the figure updates a live percent-complete dashboard visible to the project team and generates a claim-ready evidence pack with imagery and measurements attached.
5. How the AI Progress Comparison Works
Here's an analogy that's closer to the truth than most vendor explanations. Picture a quantity surveyor who has walked hundreds of sites and can glance at a partially built floor and estimate completion within a percentage point or two, because they know instinctively how a slab, then columns, then a floor plate typically sequence together. That instinct comes from pattern recognition built over years. The AI is doing something more literal but equally powerful — it isn't estimating from experience, it's directly measuring the physical dimensions and presence of every modelled element in the point cloud and comparing that measurement against the BIM model's expected geometry for that stage.
Why a Single Weekly Photo Doesn't Solve This
Some sites already take weekly progress photos for the file. The problem is that a 2D photo captures what's visible from one angle, at one moment, with no measurement attached — it's documentation, not data. Two people can look at the same photo and estimate completion five percentage points apart, and neither of them can tell you with certainty whether a specific structural element is actually finished or just looks finished from that angle.
A 3D point cloud compared against a BIM model measures volume, area, and position directly — it can confirm a slab has been poured to the correct thickness across its full footprint, not just that concrete is visible in a photo. When an element is behind formwork, inside a riser, or below grade and therefore invisible to a photo entirely, the model still tracks it through scheduled milestones tied to material deliveries and prior-stage completion, rather than guessing from what a camera happened to catch.
The material and plant tracking works on a related but simpler principle. Every tagged item has a last-known position from the previous capture. When a capture shows the item missing from its expected zone with no corresponding transfer or installation record, the system raises a flag — it isn't accusing anyone of theft, it's surfacing an unexplained discrepancy fast enough that someone can actually investigate it, rather than discovering the gap during a stocktake three months later.
6. What It Costs
I'll give you the real numbers, including the ones most vendor quotes leave out until you're deep into contract negotiation.
| Running Cost Item | Monthly Cost (AUD) | Notes |
|---|---|---|
| AI site monitoring SaaS licence | $2,200 – $3,800 | Scales with number of active sites under management |
| Drone flyover service (weekly, per site) | $1,200 – $2,000 | External pilot service or internal licensed drone operator time |
| RFID/barcode material tag consumables | $400 – $900 | Ongoing tag stock for new material and plant deliveries |
| Internal site oversight | $1,500 – $2,200 | ~0.15–0.2 FTE site manager time for review and validation |
| Total monthly running cost | $5,300 – $8,900 | $63,600 – $106,800 per year |
| One-Time Project Cost | Cost Range (AUD) | Notes |
|---|---|---|
| Vendor implementation & BIM integration | $28,000 – $48,000 | Point-cloud pipeline setup, BIM model connection, initial calibration |
| Drone hardware & licensing (if internal) | $8,000 – $18,000 | Optional — external flyover service avoids this cost entirely |
| Site manager & foreman training | $5,000 – $9,000 | Dashboard training, variance review workflow, claim-pack process |
| Single-site pilot (6-week) | $5,000 – $9,000 | Testing before multi-site rollout |
| Total one-time project cost | $46,000 – $84,000 | Median for a mid-size, multi-site NSW operation: ~$62,000 |
The Number That Surprises Most Organisations
Vendor quotes almost always lead with the platform licence. What they don't lead with is the BIM model cleanup cost — if your design model wasn't federated and coordinated to a construction-grade level of detail, someone has to fix the geometry before the comparison engine has anything reliable to measure against, and that work is frequently quoted separately, after the initial pitch.
The second hidden cost is drone flight authorisation. Sites near flight paths, hospitals, or within certain distances of airports require CASA approvals that can take two to six weeks to process — factor this into your timeline before assuming week-one flyovers are possible.
Where Your Current Progress & Loss Exposure Goes
The red slice is the primary target. AI shifts spend from unrecovered material loss and claim disputes toward monitoring and validation.
7. What Your Team Needs
Here's what I've seen derail otherwise sound projects: the assumption that a drone and a dashboard replace the site manager's judgement entirely. That's not how it works. A successful deployment needs three internal roles — none full-time, but all present and accountable.
Site Monitoring Lead (0.2–0.4 FTE): Owns the BIM model connection, coordinates flyover or camera scheduling, and reviews flagged variances for accuracy post-deployment. This person needs to understand your BIM structure deeply — they don't need to understand the point-cloud processing itself.
Site Champion (0.15 FTE from existing staff): A senior foreman or site engineer who validates the system's progress figures during the pilot and becomes the first point of contact when the site team questions a flagged material variance. Crews trust a system faster when a respected colleague has vouched for it.
Executive Sponsor (Project Director or Commercial Manager): Someone who has approved the project, can authorise the claim process to accept AI-generated evidence, and holds the organisation accountable to actually acting on flagged material variances post-deployment. Without this, a flagged theft alert sits unread and the deterrence value disappears.
On build versus buy: buy. The point-cloud processing pipeline, ongoing BIM model synchronisation, and drone data handling make a custom build impractical for any construction firm without a dedicated computer-vision function. Evaluate vendors on two criteria above all others: their track record processing point-cloud data against your specific BIM authoring software, and whether their percent-complete output has been accepted as claim evidence by a superintendent or financier on a comparable past project.
| Phase | Weeks | Key Activities | Who Leads |
|---|---|---|---|
| 1. Discovery & Scoping | 1–3 | Audit BIM model quality, site perimeter suitability, and existing material tracking; select vendor | Executive Sponsor + Monitoring Lead |
| 2. BIM Integration & Drone Authorisation | 4–8 | Connect BIM feed; secure CASA flight approvals or install fixed cameras; calibrate model against as-built conditions | Monitoring Lead + Vendor PM |
| 3. Material Tagging & Pilot | 7–13 | Tag active material and plant register; run 6-week pilot on one site; measure accuracy against manual claims | Site Champion + Vendor |
| 4. Site Team Training | 12–14 | Train site managers and foremen on the review-and-validate workflow; update claim SOPs | Site Champion |
| 5. Multi-Site Rollout | 15–20 | Extend to all active sites; move from supervised to standard review workflow | Monitoring Lead + Site Champion |
| 6. Optimisation & Review | 21–26 | Review KPIs against targets; refine variance thresholds; add sites as new projects mobilise | Executive Sponsor + Monitoring Lead |
8. How You Know It's Working
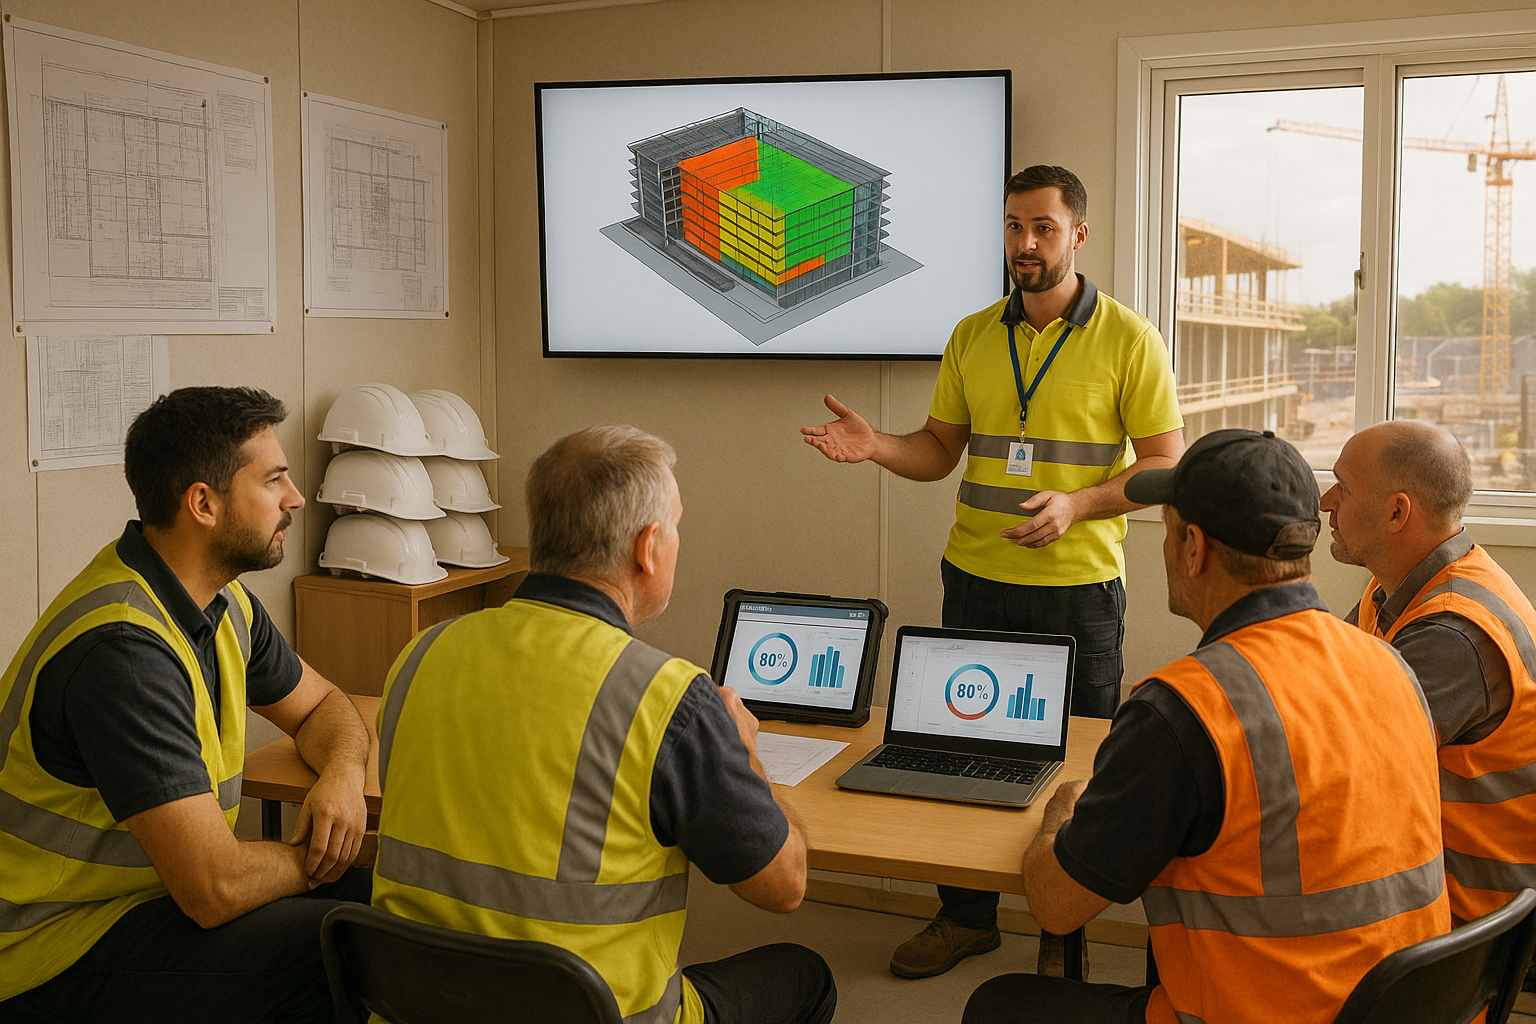
Set these five metrics as your baseline before deployment and measure them monthly. If you don't have baseline numbers, spend four weeks collecting them manually before go-live — you cannot demonstrate ROI without a before figure.
| Metric | Baseline (Typical) | 12-Month Target | How to Measure |
|---|---|---|---|
| Progress claim variance vs. as-built | 8–15 percentage points | <3 percentage points | AI-validated figure vs. superintendent-audited actual, per claim cycle |
| Material/plant shrinkage rate | 1–2% of project value | <0.7% of project value | Reconciled loss value ÷ total project value, per site |
| Time to produce a validated progress figure | 1–2 days per cycle | <4 hours | Timestamp from capture to site manager sign-off |
| Time to detect missing material/plant | 2–6 weeks | <3 days | Timestamp from disappearance to flag raised, per incident |
| Site manager hours on manual progress walks per month | 16–24 hours | <6 hours | Timesheet allocation for progress tracking activity |
In practice, the right setting for most portfolios is to treat the 12-month target as a floor, not a ceiling. The best-performing operations hit these numbers by month seven and then look at extending the same tagging infrastructure to plant utilisation tracking, which follows naturally from the same data.
9. Where to Start
If the numbers in Section 3 are compelling and you've confirmed the basics in Section 1, here are five concrete actions to take in the next 30 days:
- Run a four-week claim-variance audit. Compare your last four progress claims against an independent site measurement and calculate the average percentage-point gap. This number is your baseline.
- Assess your BIM model's construction readiness. Work with your design team to confirm the model is federated and coordinated to a level of detail sufficient for element-level progress comparison. This is what the AI measures against — operations without it aren't ready.
- Check drone flight feasibility for your active sites. Confirm CASA airspace restrictions and site perimeter suitability, or identify which sites would need fixed cameras instead.
- Run a vendor sandbox session on one live site. Before committing to any platform, give vendors access to a recent site capture and your BIM model, and ask them to show what percent-complete figure the system would have produced. Compare it against your own manual claim from that period.
- Design a six-week pilot on your highest-value active site. Pick the site with the strongest BIM model and the clearest drone access. Run the AI system in parallel with your existing progress-claim process for six weeks before relying on it alone.
Key Takeaways
- Is the opportunity real? Yes — if you're running multiple sites worth $8M or more with a maintained BIM model, the shrinkage and claim-accuracy savings typically close a business case within seven to nine months.
- Is it the right time? Only if you have a construction-grade BIM model, a workable drone or camera setup, and a client or financier willing to accept AI-generated progress evidence.
- What's the realistic saving? Use the calculator above with your numbers. A three-site portfolio worth $30M combined with a 1.5% shrinkage rate sees roughly $250,000 in annual savings against a $46,000–$84,000 implementation cost.
- What's the honest risk? A flagged variance nobody acts on costs as much as one that's never flagged — the difference is whether your site managers trust and use the alerts. Firms that appoint a site champion and enforce the review workflow see results. Firms that treat it as a set-and-forget camera system do not.
- Where to start? Four-week claim-variance audit first. No vendor conversation before you know your BIM model's readiness and your current variance gap.
Want Practical Insights on AI in Operations?
I write about applying AI to real business problems — with honest numbers and no vendor speak. Subscribe for articles delivered twice a month.
Subscribe to Newsletter →