What You'll Learn
- Why separating "what will happen" (forecast) from "what should we do" (recommendation) from "is this safe to execute" (gating) beats asking one model to do everything
- How to combine a classical gradient-boosted forecasting model with an LLM reasoning layer instead of asking an LLM to predict numbers directly
- How to build a constraint and rules engine that stops an LLM from recommending building actions that violate comfort, safety, or contract terms
- Real token and infrastructure costs for running this across a multi-building portfolio
- When a plain rules-based demand-response system is the better choice, and an agent is overkill
1. Introduction
I built this because I kept seeing the same pattern at mid-size commercial building operators: a building management system (BMS) full of live meter data, a utility bill full of demand charges nobody fully understood, and no one connecting the two in time to act. The data existed. The insight was buried in a monthly PDF invoice from the utility, three to six weeks after the consumption happened.
Facilities teams managing five, twenty, or a hundred buildings have the same three questions every day: how much energy will we use in the next 24-48 hours, what will it cost given the tariff structure in effect, and is there anything we should change right now — a setpoint, a load shift, a battery discharge — to avoid a demand charge spike. Getting the first question right is a forecasting problem. Getting the second and third right is a reasoning problem, and that's where most "smart building" tooling stops short: it forecasts and stops, leaving a human to translate a chart into a decision.
This article walks through an agent I built to close that loop — not a chatbot bolted onto a dashboard, but a system that forecasts consumption, evaluates it against tariff and comfort constraints, generates a specific recommendation with reasoning attached, and either executes it automatically or routes it to a human for approval depending on how much is at stake. It's aimed at teams who already have meter telemetry and BMS API access and want the last mile — turning a forecast into an action — done reliably.
The teams who feel this most acutely are the ones managing a portfolio, not a single site. One building's demand profile fits in a facilities manager's head. Fifty buildings, each with a different tariff structure, a different comfort tolerance, and a different mix of HVAC, lighting, and on-site battery assets, doesn't. That's the scale where a spreadsheet-and-intuition approach stops working and where the cost of getting a demand-charge decision wrong — a single missed peak can add hundreds of dollars to a site's monthly bill — starts to justify building real infrastructure around it.
I'll go through the architecture, the forecasting approach, the reasoning layer, and — because this is the part every AI project article glosses over — what it actually costs to run and where it falls apart if you push it past what it's designed for.
Before writing a line of orchestration code, the constraint that shaped everything else was this: an agent that's wrong about a comfort setpoint in a way that makes an office uncomfortable at 2pm on a Tuesday will get switched off by Wednesday, no matter how much money it saved on Monday. Trust is earned in small increments and lost in one bad afternoon. Every design decision below — the split between forecasting and reasoning, the constraint engine, the impact gate — traces back to that one constraint.
2. Current Approach & Limitations
Most buildings I've looked at manage energy with some combination of three tools, and each one hits a wall on its own.
Static BMS schedules. HVAC and lighting run on fixed time-of-day schedules set once and rarely revisited. They don't respond to weather swings, occupancy changes, or tariff structure — a schedule tuned for a mild spring day is wrong on a heatwave day, and nobody adjusts it in real time.
Threshold alarms. Facilities teams get an alert when consumption crosses a fixed kW threshold. By the time the alarm fires, the demand spike that sets the monthly demand charge has often already happened — demand charges are typically billed on the highest 15- or 30-minute interval in the billing period, so reacting after the fact doesn't help.
Standalone forecasting dashboards. Some operators do have a forecast — a chart showing predicted load for the next day. But the chart doesn't say what to do about it, doesn't account for the specific tariff rules or comfort constraints for that building, and requires someone to manually translate a line going up into an action. In practice, that translation step gets skipped most days because no one has time to sit and interpret a chart every morning.
The common thread: forecasting and decision-making are treated as separate problems solved by separate tools, with a human required to bridge them. That bridge is the part that doesn't scale past a handful of buildings.
I've also seen the opposite failure mode — a vendor demo where an LLM is given raw meter data and asked to "optimize the building," with no forecast underneath it and no rules engine constraining what it can propose. It looks impressive in a fifteen-minute demo with cherry-picked inputs. It falls apart the first time it's asked to reason about a genuinely unusual day — a heatwave combined with a public holiday combined with a tariff change — because there's no numeric model grounding its judgment, just a plausible-sounding guess dressed up as an optimization.
3. The Solution Approach
The core idea is to keep the forecasting and reasoning stages separate but connect them automatically, then gate the output by how much impact an action would have. Three deliberate design choices:
- Forecasting stays numeric, not generative. A gradient-boosted regression model (not an LLM) predicts consumption for the next 24-48 hours from meter history, weather forecast, and calendar features. LLMs are unreliable at producing calibrated numeric time-series forecasts — I don't ask one to.
- Reasoning is where the LLM earns its place. Once the forecast exists, the agent's job is to combine it with the active tariff schedule and site-specific constraints, and produce a specific, explained recommendation — "pre-cool zones 2 and 4 by 1.5°C starting at 13:00 to avoid the 14:00-18:00 peak window under the current TOU tariff." This is language and judgment work, which is what LLMs are actually good at.
- Impact-based gating, not blanket automation or blanket human review. Low-impact actions (a 1°C HVAC setpoint nudge) execute automatically. High-impact actions (discharging a battery asset, overriding a comfort constraint) go to a human approval queue. This is the difference between a system operators trust and one they turn off after the first bad recommendation.
The tech stack: a scikit-learn/LightGBM-style gradient-boosted model served from an Azure Machine Learning managed endpoint for forecasting; an orchestration layer built with LangGraph in Python (Semantic Kernel in C#) that sequences forecast retrieval, constraint checking, and recommendation generation; Azure OpenAI (GPT-4o) for the reasoning and explanation step; and an action layer that calls back into the BMS API for auto-executed actions or posts to a review queue for gated ones.
I considered and rejected a fourth option early on: a pure reinforcement-learning controller that learns an optimal control policy directly from reward signals (energy cost, comfort deviation). It's the academically cleaner approach, and there's genuine research showing RL controllers beating rule-based ones on simulated buildings. I didn't use it here for a practical reason — an RL policy is a black box to the facilities team operating it, and "the model learned this policy through trial and error and we're not entirely sure why it does what it does" is not something you can hand to a building operator who needs to explain a comfort complaint to a tenant. The forecast-then-reason-then-explain pipeline is less elegant but every step of it can be inspected, logged, and justified in plain language, which matters more than a few extra percentage points of theoretical efficiency when the system is touching real occupied spaces.
4. Architecture Overview
The system has five stages, and the order matters: data in, forecast, reason, gate, act.
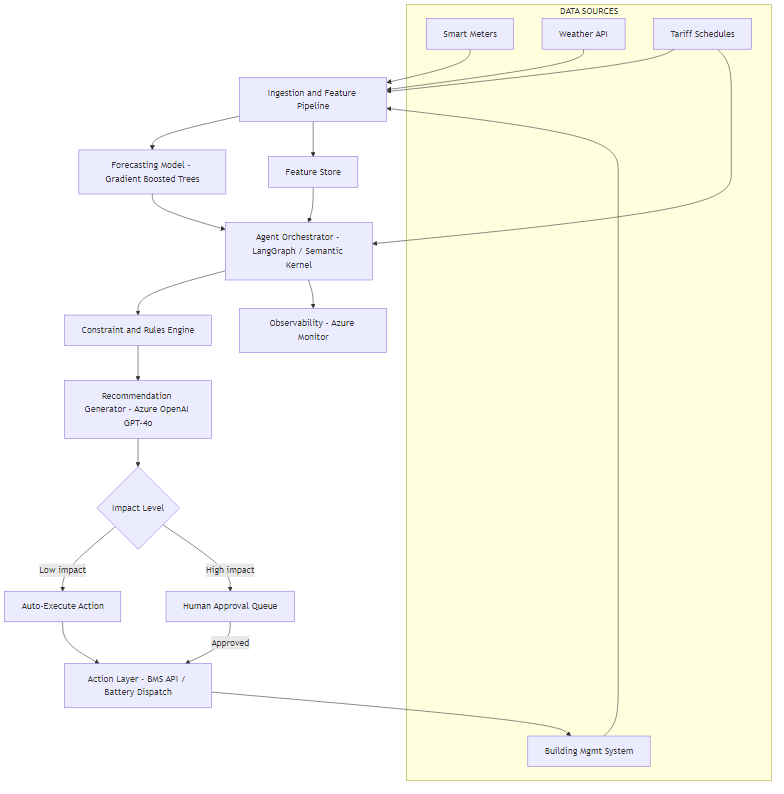
Data sources — smart meter telemetry (typically 5-15 minute intervals via the BMS or a metering gateway), a weather forecast API, the site's tariff schedule (time-of-use rates, demand charge structure, any contracted demand response obligations), and current BMS state.
Ingestion & feature pipeline — normalizes meter readings, joins weather and calendar features, and writes to a feature store so the same feature set is used for both model training and live inference (avoiding train/serve skew, which is the single most common cause of a forecasting model that scores well offline and performs badly in production).
Forecasting model — a gradient-boosted regressor predicting consumption in 30-minute buckets for the next 24-48 hours, served from a managed inference endpoint.
Agent orchestrator — pulls the forecast, current tariff rates, and site constraints, runs them through a rules engine to establish what's even permissible, then calls Azure OpenAI to generate a specific, explained recommendation grounded in that constraint set.
Gate & action layer — classifies the recommendation's impact level. Low-impact actions execute directly against the BMS API. High-impact ones land in a human approval queue with the forecast, the reasoning, and the projected savings attached, so the reviewer isn't starting from a blank chart.
Cadence matters as much as the components themselves. The forecast refreshes every 30 minutes, which is frequent enough to react to a weather forecast update or an unexpected demand spike without re-running the (relatively expensive) recommendation step so often that it becomes noise. The recommendation agent runs hourly per site by default, with an event-triggered run whenever the forecast crosses a threshold that puts the site meaningfully closer to a new peak demand interval — that event trigger is what actually catches most of the savings, since it means the system reacts within the hour to a change in conditions rather than waiting for the next scheduled run.
One architectural decision that's easy to get wrong: where state lives between runs. Early on I kept the constraint set and recent recommendation history in the orchestrator's process memory, which worked fine in local testing and broke the first time a Container App instance recycled mid-day. Constraints, tariff windows, and the last N recommendations per site now live in a small Azure Cosmos DB store the orchestrator reads at the start of every run — the orchestrator itself stays stateless, which is what makes it safe to scale horizontally across a growing portfolio without worrying about which instance "remembers" what.
5. Core Implementation
The agent state carries the forecast, the active constraints, and the recommendation as it moves through the graph. Keeping this as an explicit, typed object — rather than a loose dictionary of strings — is what makes the constraint-checking step in Section 7 reliable. It also means a schema change in the forecast payload (say, adding a confidence interval field) fails loudly at the type layer instead of silently at the LLM prompt-formatting layer three steps downstream, which is where it would otherwise surface as a confusing, hard-to-reproduce bug.
from typing import TypedDict, Literal
from pydantic import BaseModel
from datetime import datetime

class ForecastPoint(BaseModel):
    timestamp: datetime
    predicted_kw: float
    lower_bound_kw: float
    upper_bound_kw: float

class TariffWindow(BaseModel):
    start: datetime
    end: datetime
    rate_per_kwh: float
    is_demand_charge_window: bool

class SiteConstraints(BaseModel):
    site_id: str
    min_zone_temp_c: float
    max_zone_temp_c: float
    battery_min_soc_pct: float
    contracted_demand_response_kw: float | None

class Recommendation(BaseModel):
    action: str
    reasoning: str
    projected_savings_aud: float
    impact_level: Literal["low", "high"]

class AgentState(TypedDict):
    site_id: str
    forecast: list[ForecastPoint]
    tariff_windows: list[TariffWindow]
    constraints: SiteConstraints
    recommendation: Recommendation | None
public record ForecastPoint(
    DateTimeOffset Timestamp,
    double PredictedKw,
    double LowerBoundKw,
    double UpperBoundKw);

public record TariffWindow(
    DateTimeOffset Start,
    DateTimeOffset End,
    double RatePerKwh,
    bool IsDemandChargeWindow);

public record SiteConstraints(
    string SiteId,
    double MinZoneTempC,
    double MaxZoneTempC,
    double BatteryMinSocPct,
    double? ContractedDemandResponseKw);

public enum ImpactLevel { Low, High }

public record Recommendation(
    string Action,
    string Reasoning,
    double ProjectedSavingsAud,
    ImpactLevel ImpactLevel);

public class AgentState
{
    public required string SiteId { get; init; }
    public List<ForecastPoint> Forecast { get; set; } = new();
    public List<TariffWindow> TariffWindows { get; set; } = new();
    public required SiteConstraints Constraints { get; set; }
    public Recommendation? Recommendation { get; set; }
}
The orchestration graph is a straight pipeline rather than a branching agent that decides its own next step — I don't need the LLM choosing which tool to call here, because the sequence (fetch forecast → check constraints → generate recommendation → gate) is fixed and known ahead of time. LangGraph's value here is state management and observability, not dynamic routing.
This is a deliberate departure from the more common "agent decides what to do next" pattern you'll see in customer-support or research-agent projects. Here, the decision-making the LLM is trusted with is narrow and well-scoped — generate the best recommendation given a fixed, already-validated set of inputs — rather than open-ended tool selection. A linear graph is easier to test (every node has a single, predictable input shape), easier to debug (a failed run has exactly one node to inspect), and easier to reason about when something downstream — like the constraint engine in Section 7 — needs to trust that the LLM only ever sees pre-filtered, already-legal options.
from langgraph.graph import StateGraph, END

def fetch_forecast(state: AgentState) -> AgentState:
    state["forecast"] = forecasting_client.get_forecast(state["site_id"])
    return state

def check_constraints(state: AgentState) -> AgentState:
    # Narrows the forecast down to windows where an action
    # is even permissible before the LLM ever sees the data
    state["tariff_windows"] = tariff_client.active_windows(state["site_id"])
    return state

def generate_recommendation(state: AgentState) -> AgentState:
    state["recommendation"] = recommendation_agent.run(
        forecast=state["forecast"],
        tariff_windows=state["tariff_windows"],
        constraints=state["constraints"],
    )
    return state

graph = StateGraph(AgentState)
graph.add_node("fetch_forecast", fetch_forecast)
graph.add_node("check_constraints", check_constraints)
graph.add_node("generate_recommendation", generate_recommendation)

graph.set_entry_point("fetch_forecast")
graph.add_edge("fetch_forecast", "check_constraints")
graph.add_edge("check_constraints", "generate_recommendation")
graph.add_edge("generate_recommendation", END)

energy_agent = graph.compile()
public class EnergyAgentOrchestrator
{
    private readonly IForecastingClient _forecasting;
    private readonly ITariffClient _tariff;
    private readonly IRecommendationAgent _recommendationAgent;

    public EnergyAgentOrchestrator(
        IForecastingClient forecasting,
        ITariffClient tariff,
        IRecommendationAgent recommendationAgent)
    {
        _forecasting = forecasting;
        _tariff = tariff;
        _recommendationAgent = recommendationAgent;
    }

    public async Task<AgentState> RunAsync(AgentState state)
    {
        state.Forecast = await _forecasting.GetForecastAsync(state.SiteId);

        // Narrows the forecast down to windows where an action
        // is even permissible before the LLM ever sees the data
        state.TariffWindows = await _tariff.GetActiveWindowsAsync(state.SiteId);

        state.Recommendation = await _recommendationAgent.RunAsync(
            state.Forecast, state.TariffWindows, state.Constraints);

        return state;
    }
}
6. Key Technical Challenge #1: Forecasting Without an LLM
The tempting shortcut is to hand the LLM a CSV of meter history and ask it to predict tomorrow's load. I tried this early on, and the results were the kind of confidently wrong that's dangerous in a system that acts autonomously — the model would produce plausible-looking numbers with no real grounding in the site's actual load curve, and no calibrated uncertainty around them.
What works is treating forecasting as what it is: a supervised regression problem. A gradient-boosted tree model (LightGBM in practice) trained on 12+ months of interval meter data, with features for time-of-day, day-of-week, public holidays, forecast temperature and humidity, and a rolling lag of recent consumption. This isn't novel — it's the same approach utilities have used for load forecasting for years — but it's dramatically more reliable than an LLM for this specific task, and an order of magnitude cheaper to run at inference time.
The part that took iteration was feature engineering around irregular calendar effects — building occupancy on the day before and after a public holiday doesn't look like a normal weekday or a normal holiday, it's its own pattern. Getting that wrong was the single biggest source of forecast error in early testing.
I also evaluated a Prophet-style additive model and a small LSTM before settling on gradient-boosted trees, and it's worth explaining why the "simpler" option won. Prophet handles seasonality well out of the box but struggled with the sharp, weather-driven step changes commercial HVAC load produces — a building's consumption doesn't rise smoothly with temperature, it jumps once chillers stage on. The LSTM matched LightGBM's accuracy on backtests but took roughly 15x longer to retrain and was harder to explain to a non-ML facilities engineer asking "why did it predict that." Gradient-boosted trees hit the accuracy target, retrain in minutes on a month of new data, and produce feature importances I can show someone without an ML background — that combination of accuracy, retrain speed, and interpretability mattered more than squeezing out another point of accuracy from a fancier architecture.
Backtesting matters more here than in most ML projects, because the cost of a forecast miss isn't abstract — it directly changes what the recommendation agent believes is worth doing. I hold out the most recent four weeks of each site's data as a rolling backtest window and require MAPE under 6% on that window before a retrained model is promoted to serving. A model that fails that bar keeps the previous version live rather than degrading recommendations silently, which is the same "fail loud, not quiet" principle that shows up again in Section 9.
import pandas as pd

def build_features(meter_df: pd.DataFrame, weather_df: pd.DataFrame,
                    holiday_dates: set) -> pd.DataFrame:
    df = meter_df.merge(weather_df, on="timestamp", how="left")

    df["hour"] = df["timestamp"].dt.hour
    df["day_of_week"] = df["timestamp"].dt.dayofweek
    df["is_holiday"] = df["timestamp"].dt.date.isin(holiday_dates)

    # Adjacent-to-holiday days behave differently from a normal
    # weekday — this feature alone cut forecast error meaningfully
    df["is_adjacent_to_holiday"] = (
        df["timestamp"].dt.date.map(
            lambda d: (d - pd.Timedelta(days=1)) in holiday_dates
            or (d + pd.Timedelta(days=1)) in holiday_dates
        )
    )

    df["lag_24h_kw"] = df["consumption_kw"].shift(48)  # 30-min buckets
    df["rolling_7d_avg_kw"] = df["consumption_kw"].rolling(336).mean()

    return df.dropna()

def predict(model, features: pd.DataFrame) -> pd.DataFrame:
    preds = model.predict(features)
    # Quantile models give the lower/upper bound in one pass
    return pd.DataFrame({
        "timestamp": features["timestamp"],
        "predicted_kw": preds,
    })
public class ForecastFeatureBuilder
{
    public IEnumerable<ForecastFeatureRow> BuildFeatures(
        IEnumerable<MeterReading> meterReadings,
        IEnumerable<WeatherReading> weather,
        HashSet<DateOnly> holidayDates)
    {
        var joined = meterReadings
            .Join(weather, m => m.Timestamp, w => w.Timestamp,
                (m, w) => new { m, w });

        var rows = new List<ForecastFeatureRow>();
        foreach (var r in joined)
        {
            var date = DateOnly.FromDateTime(r.m.Timestamp.DateTime);

            // Adjacent-to-holiday days behave differently from a normal
            // weekday — this feature alone cut forecast error meaningfully
            var isAdjacentToHoliday =
                holidayDates.Contains(date.AddDays(-1)) ||
                holidayDates.Contains(date.AddDays(1));

            rows.Add(new ForecastFeatureRow
            {
                Timestamp = r.m.Timestamp,
                Hour = r.m.Timestamp.Hour,
                DayOfWeek = (int)r.m.Timestamp.DayOfWeek,
                IsHoliday = holidayDates.Contains(date),
                IsAdjacentToHoliday = isAdjacentToHoliday,
                TemperatureC = r.w.TemperatureC,
                ConsumptionKw = r.m.ConsumptionKw
            });
        }
        return rows;
    }
}
7. Key Technical Challenge #2: Constraining What the Agent Can Recommend
The forecast is only half the problem. The harder part is making sure the LLM's recommendation can't drift outside what's actually safe or contractually allowed — an overly aggressive pre-cool suggestion that pushes a zone below its minimum comfort temperature, or a battery discharge recommendation that ignores the site's contracted minimum state of charge, is exactly the kind of mistake that gets a system switched off after one bad day.
The fix isn't "prompt it more carefully." It's a hard rules engine that runs before and after the LLM call — before, to narrow down what actions are even in scope; after, to validate that whatever the model proposed doesn't violate a constraint. The LLM never gets to be the final authority on safety; it only gets to choose among pre-validated options and explain the choice in plain language.
The "before" pass matters as much as the "after" one, and it's easy to skip if you're only thinking about worst-case outputs. Narrowing the option set before the LLM call — only presenting setpoint ranges that are already within bounds, only surfacing battery actions if the current state of charge leaves headroom — means the model is reasoning over a smaller, safer space to begin with, which in practice also produces better recommendations, not just safer ones. An LLM asked to pick the best of five valid options tends to do that well; an LLM asked to invent a valid option from scratch and self-police the boundaries is asking it to be good at two different things at once, and it's noticeably worse at the second one.
class ConstraintViolation(Exception):
    pass

def validate_recommendation(
    rec: Recommendation, constraints: SiteConstraints,
    proposed_zone_temp_c: float | None,
    proposed_battery_soc_pct: float | None,
) -> Recommendation:
    if proposed_zone_temp_c is not None:
        if not (constraints.min_zone_temp_c <= proposed_zone_temp_c
                <= constraints.max_zone_temp_c):
            raise ConstraintViolation(
                f"Proposed setpoint {proposed_zone_temp_c}C is outside "
                f"the allowed range [{constraints.min_zone_temp_c}, "
                f"{constraints.max_zone_temp_c}] for {constraints.site_id}"
            )

    if proposed_battery_soc_pct is not None:
        if proposed_battery_soc_pct < constraints.battery_min_soc_pct:
            raise ConstraintViolation(
                f"Proposed battery discharge would drop state of charge "
                f"below the {constraints.battery_min_soc_pct}% floor"
            )

    # Impact classification happens after validation, never before —
    # a recommendation that fails validation never reaches this line
    rec.impact_level = classify_impact(rec, constraints)
    return rec

def classify_impact(rec: Recommendation, constraints: SiteConstraints) -> str:
    if rec.projected_savings_aud > 200 or "battery" in rec.action.lower():
        return "high"
    return "low"
public class ConstraintViolationException : Exception
{
    public ConstraintViolationException(string message) : base(message) { }
}

public class ConstraintEngine
{
    public Recommendation ValidateRecommendation(
        Recommendation rec, SiteConstraints constraints,
        double? proposedZoneTempC, double? proposedBatterySocPct)
    {
        if (proposedZoneTempC is double zoneTemp &&
            (zoneTemp < constraints.MinZoneTempC || zoneTemp > constraints.MaxZoneTempC))
        {
            throw new ConstraintViolationException(
                $"Proposed setpoint {zoneTemp}C is outside the allowed range " +
                $"[{constraints.MinZoneTempC}, {constraints.MaxZoneTempC}] " +
                $"for {constraints.SiteId}");
        }

        if (proposedBatterySocPct is double soc &&
            soc < constraints.BatteryMinSocPct)
        {
            throw new ConstraintViolationException(
                $"Proposed battery discharge would drop state of charge " +
                $"below the {constraints.BatteryMinSocPct}% floor");
        }

        // Impact classification happens after validation, never before —
        // a recommendation that fails validation never reaches this line
        var impact = ClassifyImpact(rec);
        return rec with { ImpactLevel = impact };
    }

    private ImpactLevel ClassifyImpact(Recommendation rec) =>
        rec.ProjectedSavingsAud > 200 || rec.Action.Contains("battery", StringComparison.OrdinalIgnoreCase)
            ? ImpactLevel.High
            : ImpactLevel.Low;
}
Where This Bites You
The dollar threshold and the "always high-impact" action list (battery dispatch, anything touching a life-safety system) need to be set with the facilities team, not guessed at by whoever's writing the code. I set the initial threshold too low on the first deployment and the approval queue filled with routine setpoint nudges nobody needed to review — that's how a human-in-the-loop system trains people to stop reading the queue.
8. Cost Analysis
Costs split three ways: LLM tokens for the recommendation step, the forecasting model's inference endpoint, and supporting infrastructure. Figures below are for a 50-building portfolio, running the recommendation agent hourly per site and the forecast refresh every 30 minutes; check current Azure pricing before budgeting, since both Azure OpenAI and Azure ML rates change.
| Component | Basis | Est. Monthly Cost (AUD) |
|---|---|---|
| Azure OpenAI (GPT-4o) — recommendation generation | ~1,500 input / ~400 output tokens per call, 24 calls/day/site, 50 sites | ~$430 |
| Azure ML managed online endpoint — forecasting | Standard_DS3_v2, single instance serving all 50 sites | ~$280 |
| Container Apps — orchestrator | Consumption plan, ~48 runs/day/site | ~$90 |
| Event Hub / IoT ingestion — meter telemetry | Standard tier, 50 sites at 5-min intervals | ~$140 |
| Azure Monitor / Application Insights | Trace + log volume for the orchestrator and endpoints | ~$60 |
| Total | ~$1,000/month |
The LLM line item is the one people expect to dominate and it doesn't — at roughly $0.0086 per recommendation call, the recommendation step costs less per site per month than a single hour of a facilities technician's time. The forecasting endpoint and telemetry ingestion are the steadier costs, and neither scales linearly with token usage the way people assume an "AI system" will.
The cost curve also flattens faster than most people expect as the portfolio grows. Going from 50 to 100 sites roughly doubles the LLM and telemetry ingestion costs, since those scale per site, but the Azure ML endpoint doesn't need to double — a single Standard_DS3_v2 instance has enough headroom to serve several hundred sites' worth of forecast requests before you need to scale out, since each inference call is a lightweight tree-model prediction, not a large model forward pass. In practice that means the per-site cost of the system actually drops as a portfolio grows past the first few dozen sites, which is the opposite of how people usually expect "adding AI" to scale.
One cost lever worth calling out: I initially ran the recommendation agent on a fixed hourly schedule for every site regardless of whether conditions had changed. Switching to the event-triggered model described in Section 4 — only running the (comparatively expensive) recommendation step when the forecast crosses a meaningful threshold — cut the LLM cost line by roughly 35% without any measurable drop in recommendation quality, because most hourly runs on a calm, predictable day were producing "no action needed" anyway.
9. Observability & Debugging
Two things matter more here than in a typical chatbot-style agent: tracking forecast accuracy against actuals over time, and keeping a full audit trail of every recommendation and what happened to it (auto-executed, approved, rejected, and by whom).
Every forecast run logs its predictions alongside a job ID; a nightly job joins those predictions against actual meter readings once they're available and writes the error metrics (MAPE, RMSE) to Application Insights as custom metrics. That closes the loop on model drift — without it, you don't find out the forecasting model has degraded until someone notices the recommendations have started looking wrong, which is too late.
from opencensus.ext.azure.log_exporter import AzureLogHandler
import logging

logger = logging.getLogger("energy_agent")
logger.addHandler(AzureLogHandler(
    connection_string=settings.app_insights_connection_string
))

def log_recommendation_outcome(rec: Recommendation, site_id: str,
                                outcome: str, reviewer: str | None = None):
    logger.info("recommendation_outcome", extra={
        "custom_dimensions": {
            "site_id": site_id,
            "action": rec.action,
            "impact_level": rec.impact_level,
            "projected_savings_aud": rec.projected_savings_aud,
            "outcome": outcome,       # auto_executed | approved | rejected
            "reviewer": reviewer,
        }
    })
public class RecommendationAuditLogger
{
    private readonly TelemetryClient _telemetryClient;

    public RecommendationAuditLogger(TelemetryClient telemetryClient)
    {
        _telemetryClient = telemetryClient;
    }

    public void LogRecommendationOutcome(
        Recommendation rec, string siteId, string outcome, string? reviewer = null)
    {
        var evt = new EventTelemetry("recommendation_outcome");
        evt.Properties["site_id"] = siteId;
        evt.Properties["action"] = rec.Action;
        evt.Properties["impact_level"] = rec.ImpactLevel.ToString();
        evt.Properties["projected_savings_aud"] = rec.ProjectedSavingsAud.ToString();
        evt.Properties["outcome"] = outcome; // auto_executed | approved | rejected
        evt.Properties["reviewer"] = reviewer ?? "system";

        _telemetryClient.TrackEvent(evt);
    }
}
Every recommendation — auto-executed or not — is written to this same audit log with its full reasoning text attached. When a facilities manager asks "why did the system pre-cool zone 3 last Tuesday," the answer needs to be a lookup, not a re-run of the model.
Beyond the accuracy and audit tracking, I set up two alert rules on top of the same telemetry that catch the failure modes that actually happen in practice rather than the ones that are interesting to build dashboards for. The first fires when forecast MAPE for a site exceeds 10% for three consecutive days — almost always a sign that something changed at the site itself (a new tenant fit-out, a decommissioned chiller) that the model hasn't adapted to yet, rather than a model quality problem. The second fires when the constraint engine rejects more than 20% of recommendations for a site in a rolling 24-hour window, which usually means the constraint bounds themselves are stale — someone changed the comfort policy or the battery's usable capacity and nobody updated the configuration. Both alerts route to the facilities team, not the engineering team, because in both cases the fix is a data or policy update, not a code change.
10. Technology Choices
Python Implementation
Why choose Python: If your team writes Python, you get access to the richest AI/ML ecosystem — and forecasting is squarely an ML problem, so this matters more here than in a pure text-agent project.
- Library ecosystem — LightGBM, scikit-learn, and pandas for the forecasting side; LangChain, LangGraph for orchestration
- Rapid prototyping — quick iteration on feature engineering, Jupyter support for exploring meter data
- Community — most time-series forecasting and AI agent tutorials are Python-first
C#/.NET Implementation
Why choose C#: If your backend is .NET — common for teams already running a BMS integration layer or an existing facilities management platform — you get first-party Microsoft support and enterprise patterns without introducing a second runtime.
- Native Azure integration — first-party SDKs for Azure ML, Azure OpenAI, and Event Hubs, Microsoft-maintained
- Enterprise patterns — dependency injection, strong typing, which matters when a bug in a constraint check has physical consequences
- Production-ready — battle-tested at scale, and easier to integrate with an existing .NET-based BMS middleware layer
The Bottom Line
Python team? Use Python — the forecasting ecosystem alone tips it. C#/.NET team, especially with an existing BMS integration in .NET? Use C#. Don't fight your stack.
11. Azure Infrastructure
Beyond Azure OpenAI and Azure Machine Learning, a few other services do real work in this system: Azure Event Hubs (or IoT Hub if the meters support it) for telemetry ingestion, Azure Container Apps for the orchestrator, and Azure Monitor for both the forecast-accuracy tracking and the recommendation audit trail described above.
Two things worth planning for from the start rather than retrofitting later. First, network access to the BMS — most commercial BMS platforms sit on an on-site network without a public endpoint, so the action layer needs either a site-to-site VPN or an Azure IoT Edge gateway running on-site to bridge cloud recommendations into local BMS commands; this is usually the longest lead-time item in a rollout, not the AI components. Second, identity — every write action against a BMS should go through a managed identity scoped narrowly to that action type, not a shared service account, so the audit trail in Section 9 can attribute an action to the specific automated process that took it rather than to a generic integration account that half a dozen systems share.
Azure AI Foundry Agent Service
Azure AI Foundry Agent Service is now generally available, providing managed orchestration for AI systems.
- Built-in routing and workflows
- Managed state persistence
- Native Azure OpenAI integration
- Observability through Azure Monitor
Check Azure AI Foundry Agent Service for current pricing.
12. ROI / Business Value
The measurable outcomes here are concrete, which is unusual for an AI project and worth leaning into when making the business case: demand charges are a line item on every commercial electricity bill, and shaving the peak 15-minute interval in a billing period has a direct, calculable dollar value.
What to Measure
- Peak demand reduction — the clearest metric; even a 5-8% reduction in monthly peak kW translates directly to demand charge savings
- Forecast accuracy (MAPE) — a leading indicator; recommendations are only as good as the forecast feeding them
- Recommendation acceptance rate — if the human approval queue is rejecting recommendations regularly, the constraint engine or forecast needs attention before you expand rollout
- Total energy spend variance — the lagging, bill-level number that ultimately justifies the system
On a portfolio spending roughly $45,000/month on energy across 50 sites, a 4-6% reduction in demand charges alone — a conservative, commonly cited range for load-shifting interventions — is worth $1,800-2,700/month, against the roughly $1,000/month infrastructure cost calculated above. It pays for itself inside the first month and the margin widens as the forecast model gets more training data.
There's a secondary benefit that doesn't show up in the demand-charge math but tends to matter to the people signing off on the project: the audit trail described in Section 9 also becomes the evidence base for sustainability reporting and any contracted demand-response program the portfolio participates in. Utilities running demand-response programs typically require documented evidence that a load reduction event actually happened and was intentional — the same recommendation log built for operational trust doubles as that evidence, which several operators I've worked with have found saves more manual reporting effort than the direct energy savings initially suggested it would.
Time-to-value is also worth setting expectations on honestly. The forecasting model needs a minimum of two to three months of site-specific meter history before it clears the 6% MAPE bar from Section 6, so a new site added to the portfolio runs in a "monitor only" mode — forecast and recommendation generated but not auto-executed — until it's earned enough of a track record for the impact gate to trust it. Rolling that out as a visible phase, rather than promising day-one automation, has consistently avoided the credibility problem of an under-trained model producing a bad recommendation before anyone had a chance to build confidence in the system.
13. When NOT to Use This
This is overkill, and sometimes actively worse than the status quo, in a few situations worth being honest about.
Skip This If:
- You're managing one building. The infrastructure cost doesn't amortize over a single site — a facilities manager checking a forecast dashboard once a day is cheaper and just as effective at that scale.
- You don't have BMS API write access. Without the ability to actually execute an action, this collapses back into "a dashboard nobody acts on" — the exact problem it's meant to solve.
- Your tariff structure is flat-rate, no demand charges, no time-of-use pricing. Most of the savings here come from shifting load around a tariff structure that rewards it. On a flat rate, there's nothing to optimize against.
- No one is available to review the high-impact queue. A human-in-the-loop system with no human checking the loop just accumulates unactioned recommendations, which is worse for trust in the system than not building it.
In several of these cases, a much simpler rules-based demand-response schedule — no LLM, no agent, just a handful of if-this-then-that triggers tied to the tariff calendar — gets most of the value for a fraction of the engineering effort. Reach for the agent when the constraint set and the number of sites are big enough that a human can no longer hold the whole decision space in their head.
14. Key Takeaways
The pattern that made this work: keep forecasting numeric and keep it out of the LLM's hands, let the LLM do the reasoning and explanation work it's actually good at, and never let it be the last line of defense on safety — that's the rules engine's job, running both before and after the model call. Gate by impact rather than automating everything or reviewing everything, because either extreme erodes trust in the system within the first month. And instrument for drift from day one; a forecasting model that quietly degrades is far more dangerous than one that fails loudly, because it keeps producing plausible, wrong recommendations that only get caught when someone notices the numbers don't add up on the next bill.
Want More Practical AI Tutorials?
I write about building production AI systems with Azure, Python, and C#. Subscribe for practical tutorials delivered twice a month.
Subscribe to Newsletter →