What This Article Covers
- Whether AI scheduling actually makes financial sense for your clinic size and no-show rate
- What changes operationally — what Monday morning looks like before and after
- A real-time ROI calculator using your own appointment volume and value numbers
- Exactly what it costs to build and run, with a warning about the integration cost that surprises most teams
- What your team needs and a realistic 24-week implementation timeline
No-shows are the silent budget leak in healthcare operations. They are predictable, they are measurable, and at most clinics, they are at least partially preventable. AI scheduling systems are now recovering 25–35% of that loss at mid-size hospitals and specialty clinics — and I'll show you exactly how the business case works before you talk to a single vendor.
Monday, 8 AM. Your scheduling coordinator opens the appointment list for the cardiology clinic. Seventeen patients booked. By 10 AM, four have not arrived. Two more call to cancel. The cardiologist sees eleven patients — and the clinic absorbs $1,680 in appointment revenue that will not be recovered. On Friday, that same coordinator spends four hours on the phone manually backfilling slots for next week. The cycle repeats.
Now the same Monday, six months after implementing AI scheduling. The system flagged six high-risk no-show appointments on Thursday. Tailored reminders went out automatically — a phone call for the patient who historically cancels without warning, an SMS for the one who responds to text. Three confirmed; three were rescheduled proactively into a controlled waitlist. Tuesday's confirmed list shows seventeen solid bookings. The coordinator spent forty minutes on scheduling that morning, not four hours.

1. Is This Right for Your Operation?
I'll address this upfront, because the business case for AI scheduling is highly volume-dependent. The same technology that delivers a 14-month payback for a 200-bed hospital delivers a 48-month payback for a 2-room allied health practice. Before doing anything else, run these checks.
This Works Well If…
- Your clinic or department sees more than 80 appointments per week
- Your no-show rate sits above 10% in any specialty
- Scheduling coordinators spend more than 6 hours per week on reactive backfilling and manual confirmations
- You have 12 months of appointment history in your practice management system
- Leadership is willing to commit 4–6 months to implementation before expecting full benefit
Walk Away If…
- Your no-show rate is consistently below 8% — the saving won't cover the running cost
- Appointment volume is under 60 per week per site — too small a base for the model to learn from
- You don't have digital appointment records going back at least 6 months in one system
- Your practice management system is not API-accessible and your vendor cannot quote an integration cost
- You are planning to change your booking platform in the next 18 months — implement after the migration, not before
2. What Changes Day-to-Day
The operational shift is as much about coordinator time as it is about no-show rates. Here's what the day-to-day looks like at each stage.
Before: Reactive and Manual
- Coordinators call all patients manually the day before — typically consuming 3–5 hours per coordinator per day in larger clinics
- No-show rate sits at 15–22% across general specialty clinics; higher in certain patient cohorts
- Backfilling cancelled slots is reactive — calls go out same-day with 15–20% uptake because patients can't rearrange their day at 2 hours notice
- Rosters are set weekly with no adjustment for predicted demand — overstaffed Thursdays, understaffed Fridays
- Operations managers review performance monthly via spreadsheet export; problems are visible only in retrospect
After: Predictive and Targeted
- The system auto-triggers reminders by channel — SMS, email, or phone — 72 hours and 24 hours out, personalised to each patient's confirmed-contact preference and historical response pattern
- No-show rate drops to 11–13% within 6 months at sites with good data quality
- Waitlist patients are automatically contacted and offered freed slots with 4 hours notice; AI-selected contacts accept at 35–42% versus 15–18% for manual calls
- Staffing recommendations for the next 48 hours are generated automatically; coordinators approve rather than create them
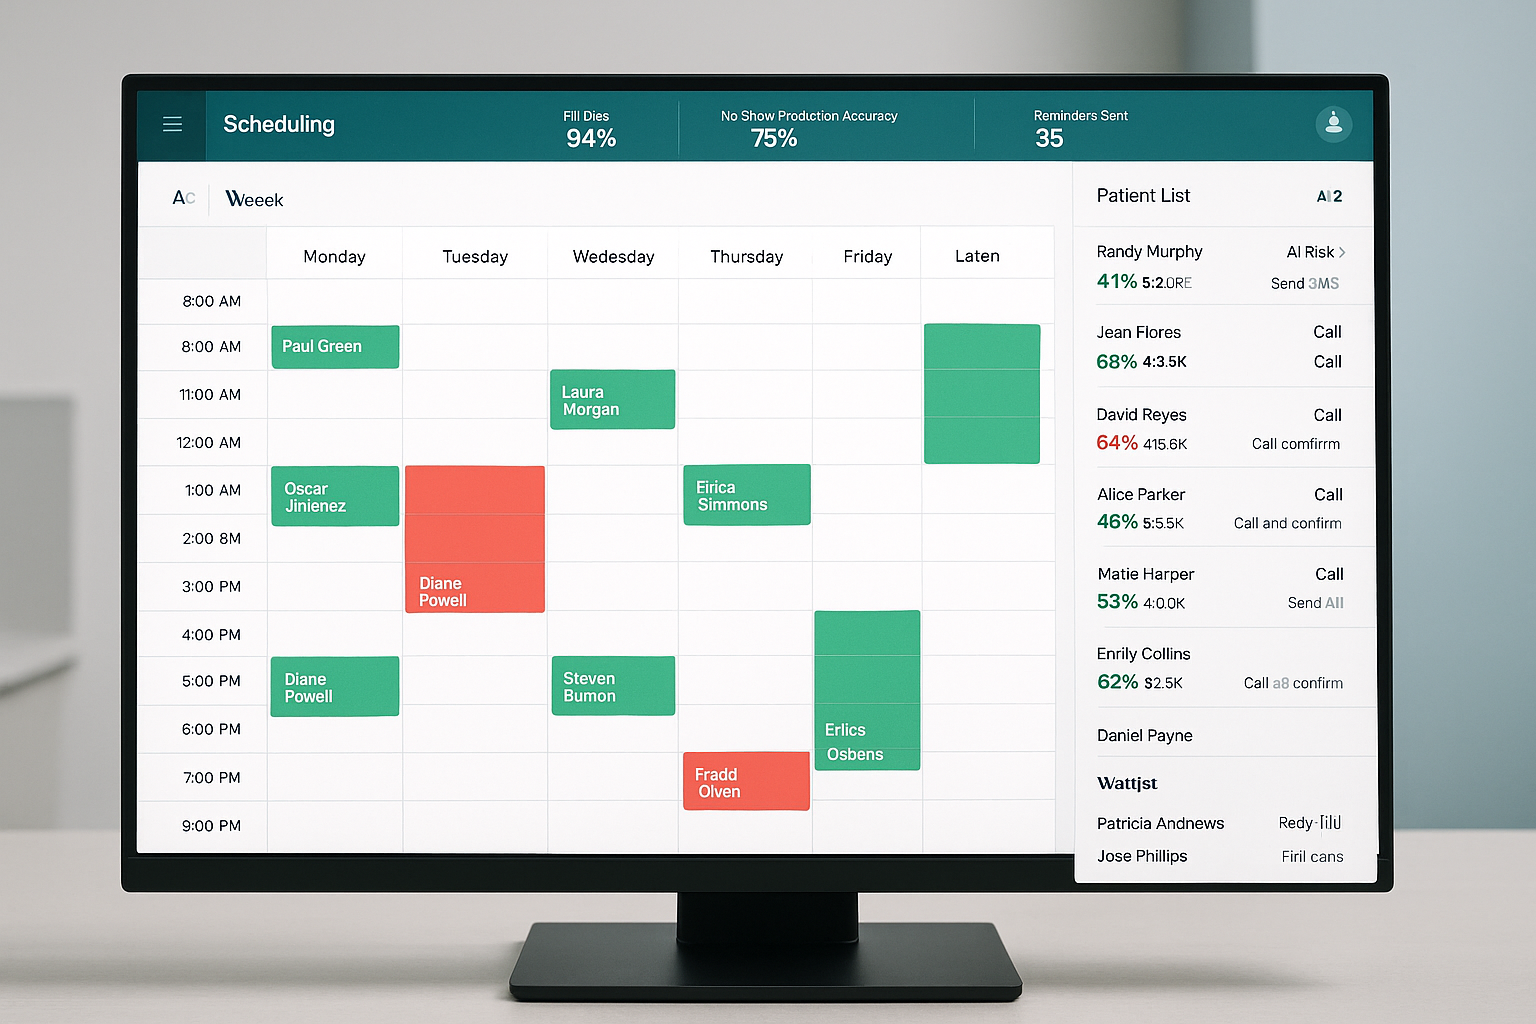
- Live operations dashboard shows fill rate, no-show forecast, revenue recovered, and room utilisation — updated in real time
"The shift in mindset is from managing what didn't show up to predicting who won't show and acting before the gap occurs. That's a fundamentally different operational posture — and it changes what coordinators spend their day doing."
3. The Business Case
A mid-size specialty clinic with 8 clinical rooms averaging 120 appointments per week at an 18% no-show rate loses approximately $109,000 per year in appointment revenue from no-shows alone. A 30% reduction in no-shows recovers $32,700 annually. Add coordinator time savings — 12 hours per week at $45/hour equals $28,080 per year — and the combined annual benefit reaches approximately $60,000. Against a project cost of $95,000 and $37,000 in annual running costs, payback is around 20 months.
For a larger hospital system with 40 clinical rooms and 500 appointments per week, the numbers shift significantly: $380,000 in annual no-show losses, $114,000 recovered per year, combined benefit above $160,000, and payback under 14 months. The number that surprises most operations teams is the indirect cost. The direct revenue loss is visible in finance reports. The indirect costs — coordinator overtime, unused specialist time, emergency backfill labour, and underutilised room hours — typically add 60–80% on top. Run both figures in your business case, not just the appointment revenue line.
ROI Calculator — AI Scheduling
Adjust the sliders to match your operation. Results update in real time.
Calculator assumes a 30% no-show reduction (conservative mid-range), $37,000 annual platform running cost, and a project implementation cost scaled to site count. Coordinator time savings are not included — add 40–50% to the annual saving figure if you factor those in.
Monthly No-Shows Per Site — Before and After AI Scheduling
Q1–Q4 2025 shows reactive baseline. Q1–Q4 2026 shows AI-assisted results with the model improving as it accumulates 6–12 months of outcome data. The Q1 2026 figure reflects a partial improvement while the model calibrates.
4. How the System Works
The architecture connects your existing booking and patient management infrastructure to a prediction and intervention layer. No rip-and-replace of your practice management system is required — this sits on top.
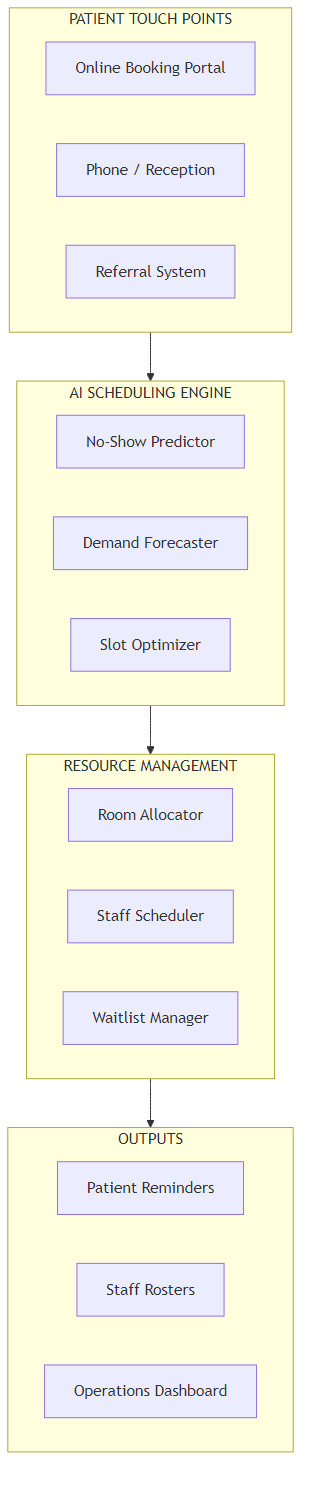
Six stages, in plain terms:
- Data ingestion. The system connects to your practice management software — MedicalDirector, Best Practice, Genie, or equivalent — and imports appointment history, patient contact preferences, and historical no-show patterns via API or scheduled data extract. No disruption to daily operations during setup.
- No-show prediction. For each upcoming appointment, the AI assigns a risk score based on factors including prior attendance record, booking lead time (appointments made more than 21 days out cancel at twice the rate of same-week bookings), time slot, day of week, referral type, and transport distance. No clinical data is used — administrative records only.
- Intervention selection. Based on the risk score, the system selects an action: a standard automated reminder for low-risk patients, a targeted phone call for medium-risk, or a proactive rescheduling offer for high-risk. Intervention thresholds and channels are configurable per specialty and per clinic.
- Waitlist management. When a cancellation is received, the system identifies the next waitlisted patient who is available for that slot and contacts them automatically. Average uptake from AI-selected contacts runs at 38–42% versus 15–18% from manual coordinator calls — because the system matches slot time to the patient's stated availability preferences rather than working alphabetically through a list.
- Roster optimisation. Using predicted demand for the next 7 days, the system generates staffing recommendations. These are recommendations that coordinators approve, not automated scheduling. In practice, sites accept 70–80% of recommendations without change.
- Performance reporting. The operations dashboard shows real-time fill rate, no-show forecast accuracy, revenue recovered, and coordinator time saved. Weekly summary reports are distributed to clinic managers automatically.
5. How the AI No-Show Prediction Works
Think of the prediction model as a credit-risk score — not predicting that one specific patient will default, but assigning a probability based on the behaviour of every patient with similar characteristics who historically did not attend. The model does not access clinical records. It knows only what the administrative appointment system knows.
Here's what the model finds in practice: patients who book appointments more than 21 days in advance cancel at a rate 2.3 times higher than those who book within 7 days. Monday morning slots carry a 22% no-show rate versus 11% for mid-Tuesday. Follow-up appointments have a 35% higher non-attendance rate than initial consultations. Patients who have cancelled twice before, without rescheduling within 30 days, have a 55% probability of not attending their next booking.
The Key Distinction vs. a Universal Reminder System
A blanket "send SMS the day before" approach has measurable but limited impact on no-shows — because most patients who receive it would have attended anyway. The AI doesn't reduce reminders; it redirects effort. Instead of sending 120 identical SMS messages to 120 patients, the system sends 18 phone call alerts to the 18 patients whose booking pattern suggests a 60%+ probability of not attending. That targeting is what moves the needle from 5% no-show reduction (universal reminders) to 25–35% reduction (AI-targeted interventions).
The model needs 12 months of appointment history to reach reliable accuracy. With 6 months of data, it performs at 70–75% of its eventual accuracy and is still worth implementing. With less than 6 months of data, do not proceed — the predictions will be unreliable enough to erode coordinator confidence in the system before it has had time to learn.
6. What It Costs
Be sceptical of any vendor quoting a single all-inclusive price without breaking out integration costs separately. In my experience, integration is the line item that blows out most healthcare AI projects — and it's almost always because the scope was not confirmed before contract signing.
| Annual Running Cost | Amount |
|---|---|
| Cloud platform licence | $18,000–$24,000 |
| Integration maintenance | $6,000 |
| SMS / communication costs | $3,600 |
| Internal system admin (0.1 FTE) | $7,500 |
| Total annual running cost | $35,100–$41,100 |
| One-Time Project Cost | Amount |
|---|---|
| Software implementation and configuration | $45,000–$65,000 |
| Practice management system integration | $18,000–$30,000 |
| Data preparation and historical validation | $8,000–$12,000 |
| Staff training across all sites | $5,000 |
| Testing and go-live support | $6,000 |
| Total project cost | $82,000–$113,000 |
The Number That Surprises Most Teams
Integration cost. If your practice management system is older than 7 years, or runs on a proprietary database with no published API documentation, expect integration to come in at the top of that range — or above it. Ask any vendor for a written integration scope specific to your practice management version before signing any contract. A scope document that says "integration: TBC" is not a scope. Walk away from that proposal or require a cost ceiling before proceeding.
Where Your Scheduling Spend Currently Goes
The red slice — unplanned gaps from no-shows and late cancellations — is the primary target. AI scheduling shifts spend from reactive recovery to proactive prevention.
7. What Your Team Needs
The internal team requirement is modest compared to most clinical IT projects. Here's what you need:
- Project sponsor — Operations Manager or Head of Administration. Approves decisions, resolves blockers. 0.2 FTE during implementation.
- Integration lead — someone with access to your practice management system and authority to engage your software vendor. This is the single most critical role. 0.5 FTE during the 5-week integration phase.
- Clinical champion — a clinical lead who can confirm that AI-suggested scheduling changes are clinically appropriate for your patient cohort. 0.1 FTE ongoing.
- Data analyst — to validate the historical appointment data export and confirm data quality before model training begins. 0.3 FTE for 4 weeks.
Build vs. buy: Build only if you have an in-house team with documented experience integrating clinical administration systems and you have more than 3 sites. The major platform vendors have already solved integration with MedicalDirector, Best Practice, Genie, and the leading hospital PAS systems in Australia. For a single clinic or small network, the economics of building will always lose to a specialist platform — typically by a factor of 3 to 5 in total cost of ownership over 3 years.
| Phase | Duration | Key Milestone |
|---|---|---|
| Data extraction and validation | Weeks 1–3 | 12 months of clean appointment history confirmed |
| Integration with practice management system | Weeks 4–8 | Live data flowing, tested and signed off |
| Model training and calibration | Weeks 9–12 | No-show prediction accuracy above 70% |
| Soft launch — one clinic or specialty | Weeks 13–16 | First 500 AI-predicted appointments processed |
| Full rollout across all sites | Weeks 17–24 | All departments live, waitlist automation active |
| Steady-state optimisation | Month 7 onward | Per-channel reminder rules tuned, roster logic refined |

8. How You Know It's Working
These are the five metrics to track from week one. Pull them from your scheduling system monthly and compare against baseline. Don't wait for a 12-month review — the model should show measurable improvement by month 3.
| Metric | Baseline (Typical) | 12-Month Target |
|---|---|---|
| No-show rate (% of booked appointments) | 15–22% | Reduce by 25–35% |
| Coordinator hours on scheduling (weekly) | 18–24 hours/week | Reduce to 10–14 hours/week |
| Appointment fill rate (% of slots utilised) | 78–84% | 85–92% |
| Waitlist uptake rate (% accepting recalled slot) | 15–20% | 35–45% |
| Reminder response rate (confirmed within 24h) | 45–55% | 65–75% |
9. Where to Start
- Run a 3-month no-show audit. Pull the last 12 months of appointment data by specialty, day of week, booking lead time, and patient type. Identify your top 3 no-show segments — they will typically account for 55–65% of total no-shows. This audit takes one analyst 3–4 days and will sharpen every conversation you have with vendors.
- Quantify the coordinator time cost. Ask your scheduling team to log actual time spent on manual confirmations, backfilling, and rescheduling for four weeks. The true cost of scheduling inefficiency is typically 60–80% higher than the direct appointment revenue loss shown in finance reports.
- Check your integration readiness. Contact your practice management system vendor directly and ask: does the system have a REST API or HL7 FHIR interface with published documentation? If the answer is no or uncertain, factor additional integration cost into every vendor quote you receive — and add 3–4 weeks to the implementation timeline.
- Run a vendor RFQ with a binding integration scope. Require each vendor to provide a fixed-price integration scope specific to your practice management system version. Time-and-materials integration without a cost ceiling is a risk that has derailed otherwise sound projects. Require a ceiling or walk.
- Pilot with your highest no-show specialty first. Implement reminders-only in the specialty with your worst no-show rate. Measure for 8 weeks. Prove the model before enabling waitlist automation and roster optimisation across the whole organisation.
Key Takeaways
Decision Framework
- Is the opportunity real for your clinic? Use the ROI calculator above with your actual no-show rate and appointment volume. If the annual saving doesn't exceed $50,000, the running cost may not justify the project.
- Is the data there? You need 6–12 months of digital appointment history in a single system. Without it, model accuracy will be too low to generate coordinator confidence in year one.
- Is integration costed correctly? Get a written, fixed-price integration scope before any contract. This single step prevents the most common cost overrun in healthcare AI scheduling projects.
- Is your team resourced? The integration lead role is the critical path. If you cannot dedicate 0.5 FTE for 5 weeks to the integration phase, push the project start date until you can.
- Is the vendor honest? Be sceptical of any vendor who cannot tell you your expected no-show reduction rate based on your actual data. A good vendor will ask for a data sample and return a modelled projection before you sign. A vendor who quotes 40–60% improvement without seeing your data is quoting the marketing sheet, not your operation.
Want Practical Insights on AI in Operations?
I write about applying AI to real business problems — with honest numbers and no vendor speak. Subscribe for articles delivered twice a month.
Subscribe to Newsletter →