What This Article Covers
- Whether AI triage makes operational and financial sense for your ED size and LWBS rate
- What changes day-to-day — what the nursing workflow looks like before and after
- A real-time ROI calculator based on your LWBS volume and presentation revenue
- The full cost picture — including the EDIS integration risk that most projects underestimate
- A realistic 26-week implementation timeline and what clinical governance requires before go-live
Patients who leave emergency departments without being seen represent both a clinical risk and a measurable financial loss. AI-assisted triage is reducing that rate by 40% at sites with structured implementation — and the adverse event benefit is typically larger than the revenue recovery that gets included in vendor ROI sheets.
Thursday, 11 PM. A 52-year-old man arrives at the emergency department with chest tightness and shortness of breath. The waiting room has 34 patients. The triage nurse has eight patients ahead of him in queue. He receives a category 3 — urgent — and is told to wait. Forty-five minutes later, he leaves. He doesn't feel heard. The wait seems infinite. He thinks it's probably anxiety. It is not anxiety. He returns by ambulance three hours later with a STEMI — a full ST-elevation myocardial infarction. The cost to the hospital: $42,000 in ICU admission and interventional cardiology. The cost to the patient: six weeks of recovery that was partially preventable.
The same presentation, same waiting room, same Thursday night — but with AI-assisted triage in place. As the nurse enters the patient's vitals and chief complaint, the system compares the pattern against 18 months of historical ED outcomes. Age, sex, symptom combination, blood pressure reading — the model flags it: this presentation matches a historical cohort with a 41% cardiac event rate. Recommended escalation: category 2. ECG within 8 minutes. The nurse follows it. The ECG shows ST elevation. The patient is in the cardiac catheterisation lab within 28 minutes of arrival.
1. Is This Right for Your Emergency Department?
I'll address this upfront. AI triage decision support is not appropriate for every ED, and the consequences of implementing it poorly are more serious than in most other operational AI projects because it operates in a clinical care pathway. Run these checks before doing anything else.
This Works Well If…
- Your ED processes more than 15,000 presentations per year — below this volume, the model has insufficient data to calibrate accurately to your patient population
- Your current LWBS rate exceeds 2% — the national average sits at 3–4%, and if you're in that range, the financial and clinical case is almost certainly positive
- Average wait-to-treatment time in your department exceeds 90 minutes in peak periods
- Your EDIS has an accessible API or data export capability and your state health IT team can confirm this in writing
- Clinical leadership views AI as augmenting triage judgement rather than replacing it — this distinction determines whether the project succeeds or stalls on culture
Walk Away If…
- Your ED sees fewer than 8,000 presentations per year — volume is too low for the model to calibrate reliably to your specific patient cohort
- Triage records are still on paper or in a system that cannot export structured data — no AI triage product can work with unstructured paper records
- Clinical leadership views AI triage recommendations as a threat to professional judgement — this project will fail on culture before it fails on technology
- You are currently replacing or upgrading your EDIS — implement AI triage after the migration is stable, not during it
- Your ED has no formal triage re-assessment process — AI triage enhances a structured clinical workflow; it cannot substitute for one that doesn't yet exist
2. What Changes Day-to-Day
The operational shift is in two dimensions: the triage decision itself, and the continuous monitoring of the waiting room as a dynamic clinical population. Both require workflow changes that are modest if well-designed, and disruptive if not.
Before: Single-Point Assessment
- The triage nurse assesses each patient using the Australasian Triage Scale (ATS), relying on clinical training, observation, and self-reported history at the point of arrival
- Acuity decisions carry inter-rater variability — the same presentation can receive category 2 from one experienced nurse and category 3 from another, without either decision being clinically wrong
- Waiting room deterioration is identified only if a nurse proactively reassesses or the patient re-presents to the desk
- LWBS rates are tracked and reported monthly — by the time a trend is visible in the data, it has been happening for 4–6 weeks
- Bed allocation is managed manually, with coordinators checking physical or basic digital tracking boards and communicating by phone
After: Continuous Population Monitoring
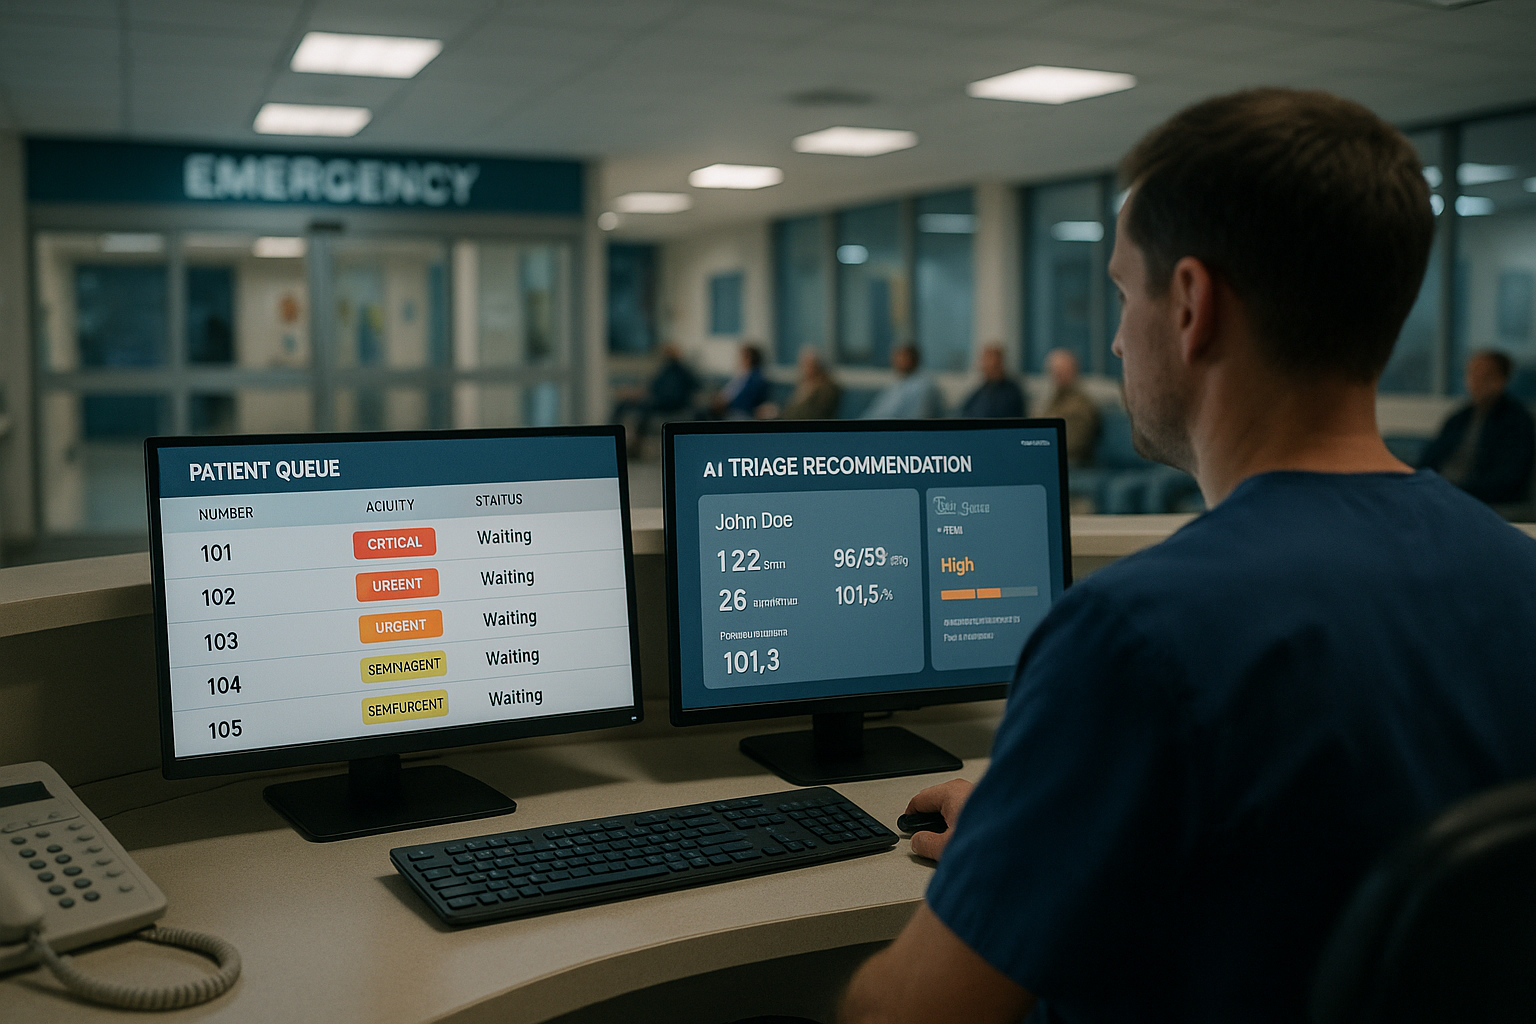
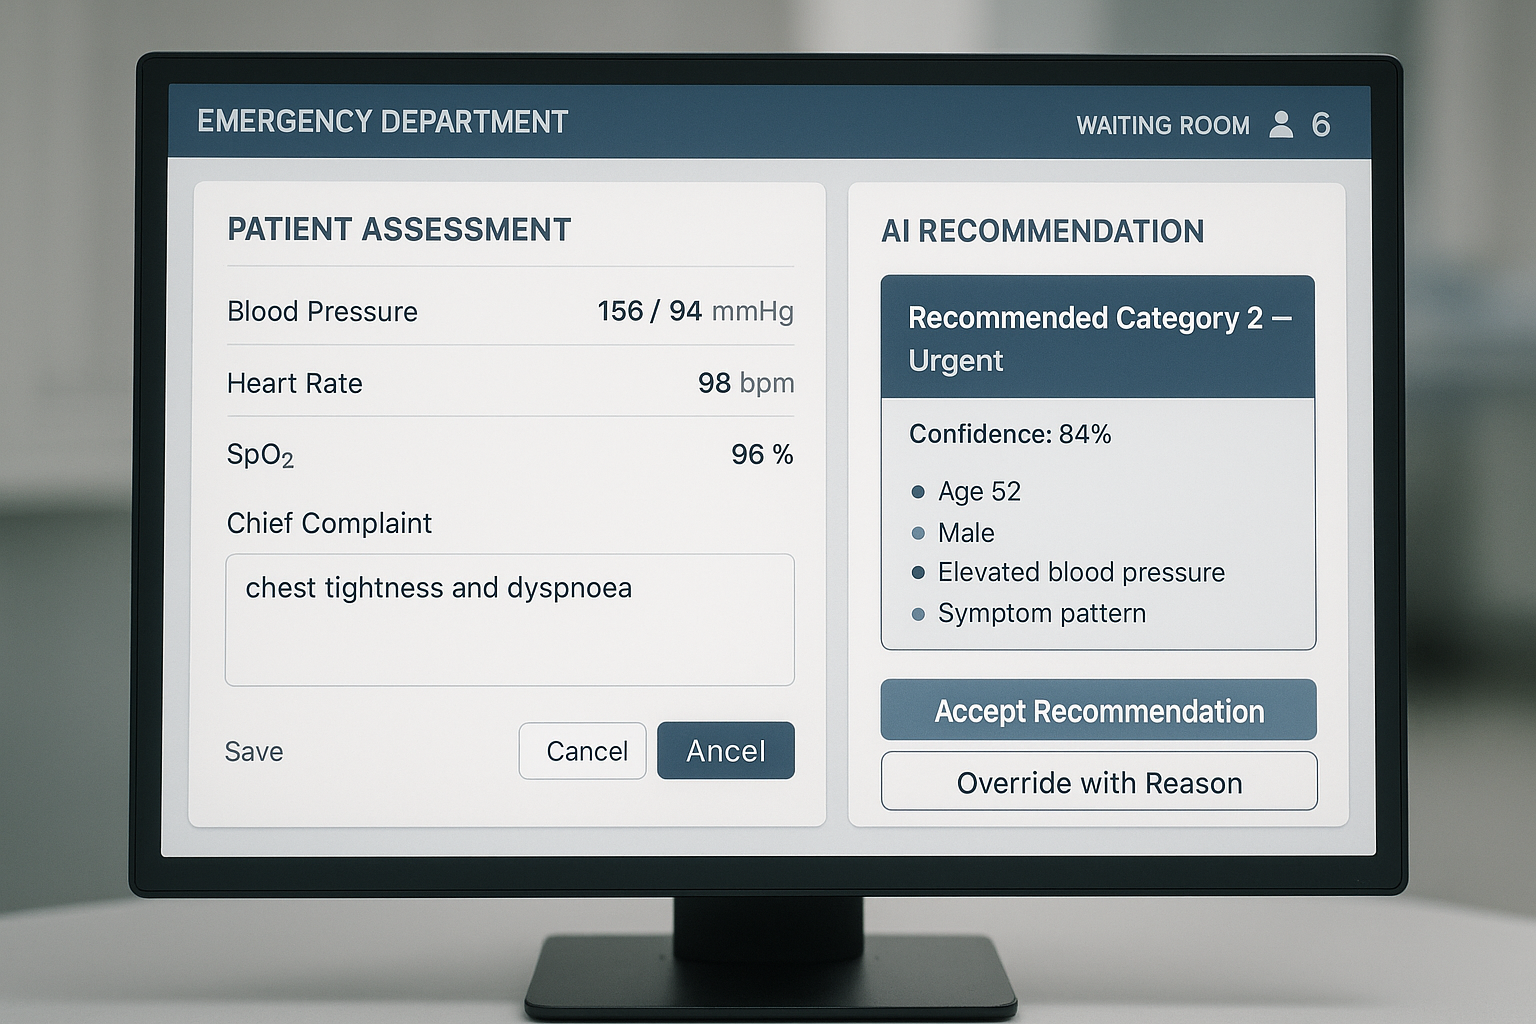
- As each patient is triaged, the AI model analyses the presentation against 18 months of historical outcomes and generates an acuity recommendation with a confidence score and the key driving risk factors
- The nurse sees the recommendation, retains full clinical authority to accept or override, and documents agreement or override in a single click — override records feed quarterly model retraining
- For every patient in the waiting room, the system continuously monitors their time waiting and flags any whose condition profile matches historical patterns of deterioration — the alert reaches the triage station before the patient re-presents
- LWBS risk flags appear at 30-minute and 60-minute marks for patients whose profile suggests elevated abandonment risk, prompting proactive check-in
- Bed allocation recommendations update automatically as patient status changes, reducing coordinator overhead and the communication delay between clinical and operational staff
"The shift in mindset is from reacting to what's visible at the triage desk to continuously assessing the entire waiting room as a dynamic clinical population. That's what changes when you add AI to the process."
3. The Business Case
A 300-bed public hospital ED with 45,000 annual presentations and a 3% LWBS rate loses approximately 1,350 patients per year who leave without being seen. At an average revenue value of $850 per ED presentation, that's $1.15 million per year in presentations that do not convert to care. A 40% LWBS reduction recovers $460,000 annually. Add the avoided cost of adverse events in the waiting room — each preventable critical deterioration costs an average of $28,000 in escalated care — and the total annual benefit reaches $530,000–$720,000 depending on your case mix and adverse event rate.
The number that surprises most clinical executives is the adverse event avoidance line. Most LWBS business cases presented to boards focus only on revenue recovery. The clinical governance benefit — documented reduction in missed critical presentations — is typically worth more than the revenue line and is almost entirely absent from vendor ROI models. Build both into your business case before presenting to the board.
ROI Calculator — AI ED Triage
Adjust the sliders to match your emergency department. Results update in real time.
Calculator assumes a 40% LWBS reduction (mid-range for well-implemented systems), $57,000 annual platform running cost, and implementation cost scaled to ED presentation volume. Adverse event avoidance savings are not included — add 15–25% to the annual saving figure if you include prevented escalation costs.
Average ED Wait Time (Minutes) Per Quarter — Before and After AI Triage
Q1–Q4 2025 shows reactive triage baseline. Q1–Q4 2026 shows AI-assisted results. Q1 reflects partial improvement during the model calibration period; full benefit is visible by Q3.
4. How the System Works
The architecture sits alongside your existing Emergency Department Information System (EDIS) — it does not replace it. The AI layer receives data from your EDIS, processes it against a trained outcome model, and returns recommendations through the EDIS interface or a purpose-built clinical support panel.
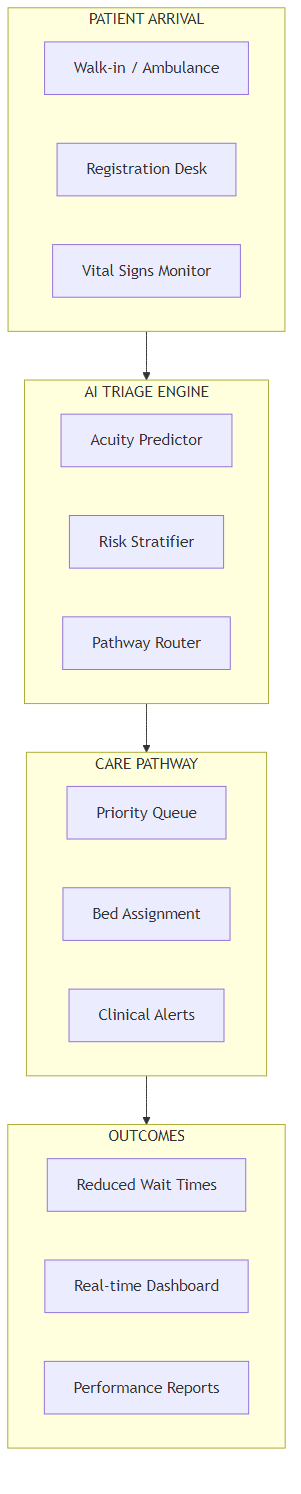
Six stages, in plain operational terms:
- Patient arrival and registration. When a patient arrives, demographic and chief complaint data is entered into the EDIS — systems such as Cerner FirstNet, iSoft, or state-provided platforms. This data immediately enters the AI processing queue.
- Vital signs capture. The triage nurse records blood pressure, heart rate, respiratory rate, temperature, and oxygen saturation. These values, combined with the chief complaint and patient demographics, form the primary input to the AI model. No additional data entry is required from nursing staff.
- Acuity prediction. The model compares the current presentation against its training cohort — every patient with a similar profile recorded over the past 18+ months — and generates an acuity recommendation aligned to the Australasian Triage Scale (categories 1–5), with a confidence score and the specific risk factors driving the recommendation. This takes under 2 seconds.
- Nurse review and override. The nurse sees the recommendation alongside their own clinical assessment. They accept it with one click or override it and record the clinical reason. Override rates in well-calibrated systems run at 8–12%. Every override feeds into the quarterly model retraining cycle, so the model improves continuously against your specific patient population.
- Continuous waiting room monitoring. For every patient in the waiting area, the system tracks elapsed wait time, any re-assessment vital sign entries, and the evolving match against deterioration outcome patterns. Patients crossing an alert threshold generate a notification at the triage station — prompting proactive re-assessment before the patient self-escalates or leaves.
- Bed allocation and flow optimisation. As patient status changes — triaged, admitted, discharged, or escalated — bed allocation recommendations update in real time. The bed coordinator sees current occupancy, predicted admissions for the next 2 hours, and recommended bed holds for incoming high-acuity cases.
5. How the AI Triage Prediction Works
The model is a pattern recognition system trained on every triage decision and final diagnosis your ED has recorded over the past 18 months. It does not diagnose — that responsibility remains with the clinician. What it does is flag when a patient's current presentation matches the historical pattern of patients who were initially triaged lower than their eventual acuity required, and whose wait time contributed to a worse outcome.
Here's what the model finds in practice: patients aged 45–65 presenting with chest symptoms and a systolic blood pressure above 150 mmHg have a 41% probability of requiring category 2 care, regardless of whether their initial presentation appears self-reported as mild. Patients who have been waiting more than 45 minutes with an unresolved category 3 presentation have a 3.2-times higher LWBS rate than those who received a proactive check-in at the 30-minute mark. Presentations involving shortness of breath and SpO2 below 94% generate adverse outcomes in the waiting room at twice the rate of presentations above that threshold, even when initially assigned the same triage category.
The Key Distinction from a Rule-Based Alert System
A rule-based alert fires when a single threshold is crossed — heart rate above 120 BPM, for example. The AI model fires when the combination of factors matches a historical pattern that preceded adverse outcomes: a 52-year-old male with mild tachycardia, chest tightness, and elevated blood pressure who has been waiting 38 minutes is a different risk profile than a 24-year-old with the same heart rate after a sports injury. Rules catch obvious outliers. The model catches the subtle presentations where the individual values all sit within normal range but the pattern as a whole does not.
The calibration period matters more in AI triage than in most other operational AI applications, because the consequences of a miscalibrated model operate in a clinical care pathway. Expect 3–4 months before recommendations align reliably with your patient cohort. During this period, track override rates, escalation accuracy, and missed escalation rates weekly. If override rates are above 20% at month 3, the model is not yet calibrated to your population — escalate this to your vendor before expanding deployment. Be sceptical of any vendor who says their model achieves target accuracy in under 8 weeks for a new site. That claim requires independently verifiable site-specific validation data, not marketing references.
6. What It Costs
Here's what I've seen derail otherwise sound projects: the EDIS integration cost is consistently the line item that blows out, and it is almost always because the scope was written based on what integration should cost in theory rather than what it costs for your specific EDIS version, state configuration, and IT team capacity.
| Annual Running Cost | Amount |
|---|---|
| Cloud platform licence | $28,000–$36,000 |
| EDIS integration maintenance | $8,000 |
| Clinical governance and quarterly model review | $6,000 |
| Internal system admin and coordination (0.15 FTE) | $11,250 |
| Total annual running cost | $53,250–$61,250 |
| One-Time Project Cost | Amount |
|---|---|
| EDIS integration and data extraction | $55,000–$75,000 |
| AI model implementation and calibration setup | $50,000–$65,000 |
| Clinical workflow design and governance documentation | $18,000 |
| Staff training (clinical and administrative) | $12,000 |
| Testing, shadow mode validation, and go-live support | $8,000 |
| Total project cost | $143,000–$178,000 |
The EDIS Integration Risk
Every state and territory in Australia operates a different primary EDIS, and some run custom configurations that are not publicly documented. Before signing any AI triage contract, get written confirmation from your EDIS vendor that the integration is technically feasible for your specific system version. "We've done it at another hospital" is not sufficient — that hospital may run a different version, different state configuration, or different HL7 schema. Require a specific integration scope document for your environment, with a cost ceiling, before committing to a vendor.
Where Your ED Flow Inefficiency Currently Sits
Extended waits and LWBS — the red slice — is the primary intervention target. AI triage addresses both acuity accuracy and continuous monitoring simultaneously.
7. What Your Team Needs
The clinical governance requirement sets this project apart from most operational AI implementations. The team structure needs to reflect that.
- Project sponsor — ED Director or General Manager, Emergency Services. Responsible for escalation authority, clinical governance sign-off, and board-level reporting. 0.2 FTE during implementation.
- Clinical champion — A senior emergency nurse or emergency physician who understands how the AI recommendation model works and can translate it for clinical staff during training and the calibration period. This is the most important role for adoption. 0.3 FTE during the first 6 months.
- EDIS integration lead — Someone with operational access to your EDIS and an established working relationship with your state health IT team. Without this person, the integration phase drags from 6 weeks to 6 months. 0.5 FTE for 10 weeks.
- Clinical governance lead — Ensures the system has documented oversight protocols: who reviews the model, how overrides are recorded, how performance is audited quarterly, and what the escalation path is if recommendations drift outside clinical parameters. 0.1 FTE ongoing.
Build vs. buy: Buy, without qualification. AI decision support in an emergency clinical setting must conform to Therapeutic Goods Administration (TGA) Software as a Medical Device (SaMD) guidance where it makes clinical recommendations that influence care. Purpose-built vendors have navigated TGA classification, clinical validation requirements, and EDIS integration complexity. An in-house build must navigate all of that from scratch, which adds 18–24 months and $400,000–$600,000 in compliance cost before you reach clinical validation. The economics do not support building unless you are a state health department deploying across an entire network.
| Phase | Duration | Key Milestone |
|---|---|---|
| Historical EDIS data extraction and validation | Weeks 1–4 | 18 months of clean triage records confirmed and structured |
| EDIS integration | Weeks 5–10 | Live triage data flowing to AI engine, tested against reference cases |
| Model training and initial calibration | Weeks 11–16 | Override rate below 15%, escalation accuracy above 82% |
| Shadow mode — AI running, not displayed to clinical staff | Weeks 17–20 | Internal validation of recommendations vs. clinical decisions documented |
| Soft launch — display to nurses, track override rate | Weeks 21–26 | First 1,000 AI-assisted triage assessments complete |
| Full deployment and quarterly retraining cycle | Month 7 onward | Override rate stabilised at 8–12%, LWBS reduction visible in data |

8. How You Know It's Working
Track these five metrics from the first week of shadow mode. Pull them weekly during calibration, then monthly at steady state. The model should show measurable improvement in escalation accuracy by month 3. If it doesn't, escalate to your vendor — do not wait for the 6-month review.
| Metric | Baseline (Typical) | 12-Month Target |
|---|---|---|
| LWBS rate (% of annual presentations) | 3–4% | Reduce to 1.8–2.5% |
| Median triage-to-treatment time (Category 2) | 25–35 minutes | Under 20 minutes |
| Deterioration alerts actioned within 15 minutes | 65% (manual process) | Above 85% |
| AI recommendation override rate | — (baseline calibration) | Stabilise at 8–12% |
| Adverse events in waiting room | Current documented rate | Reduce by 30–40% |
9. Where to Start
- Pull your LWBS data for the past 12 months. Break it down by triage category, time of day, and day of week. Identify your peak LWBS windows — they typically account for 60% of annual LWBS events. Use this data to build a business case from your actual numbers, not national benchmarks.
- Request an EDIS integration feasibility assessment from your state health IT team. This is the single most important pre-procurement step. Ask them specifically: can our EDIS export real-time triage data in a structured HL7 or FHIR format? If the answer is uncertain, factor additional integration cost and 4–6 weeks into every vendor timeline you receive.
- Engage your clinical governance team early. AI decision support in a clinical pathway requires documented governance — who reviews the model, how overrides are recorded, how performance is audited, what the escalation path is if accuracy degrades. Getting governance design right before procurement prevents a post-implementation stall that can extend by 6 months.
- Require shadow mode as a contractual deliverable. The AI should run in parallel with clinical practice — visible only to the project team — for a minimum of 4 weeks before recommendations are displayed to clinical staff. This is how you validate accuracy against your patient population before it influences care. Any vendor unwilling to offer shadow mode as a contractual phase is a vendor unwilling to be measured before go-live.
- Pilot in a single shift or single area first. Deploy to overnight shift in your ED, or to your fast-track area, where you can closely monitor recommendations and gather feedback from a small group of senior nurses. Prove the model in a contained environment before expanding to full department coverage.
Key Takeaways
Decision Framework
- Is the opportunity real for your ED? Use the ROI calculator above with your LWBS count and presentation revenue. If LWBS exceeds 2% at more than 15,000 annual presentations, the business case is almost certainly positive — even before adding adverse event avoidance.
- Is the clinical governance infrastructure in place? AI triage decision support must have documented oversight protocols before go-live. This is not optional and it is not a post-implementation task. Plan 6–8 weeks for governance design before you sign a vendor contract.
- Is your EDIS integration confirmed? Get written confirmation from your state health IT team that real-time data export is feasible before briefing any vendor. This single step prevents the most common 3–6 month implementation blowout in ED AI projects.
- Is shadow mode in the contract? Require a minimum 4-week shadow mode phase as a contractual deliverable. This is your mechanism for validating model accuracy before it reaches the clinical environment.
- Are you measuring the right outcomes? Be sceptical of any vendor quoting wait time reduction figures without disclosing their override rate. A model overridden 25% of the time is producing recommendations that clinical staff don't trust — and a recommendation that isn't trusted is worse than no recommendation, because it creates workflow friction without benefit.
Want Practical Insights on AI in Operations?
I write about applying AI to real business problems — with honest numbers and no vendor speak. Subscribe for articles delivered twice a month.
Subscribe to Newsletter →