A single hour of unplanned downtime on a manufacturing line costs between $10,000 and $250,000 depending on the industry. Most of that cost is avoidable.
Every operations team I've talked to runs some version of the same maintenance playbook: either wait for things to break (reactive), or replace parts on a fixed calendar whether they need it or not (preventive). Both approaches burn money. Reactive maintenance causes cascading failures that shut down entire lines. Calendar-based replacement swaps out components with 60% useful life remaining.
The promise of predictive maintenance has been around for years, but traditional approaches require dedicated data science teams building custom ML models for each equipment type. That's a six-figure investment before you see any results. What if we could use an LLM-powered agent to analyze sensor telemetry, detect anomalies, and generate human-readable maintenance recommendations — without needing a bespoke model for every machine?
In this two-part series, I'll show you how to build a predictive maintenance agent using Azure OpenAI with a multi-agent architecture in both Python (LangGraph) and C# (Semantic Kernel). Part 1 covers the architecture and core implementation. Part 2 dives into production costs, observability, and when this approach is overkill.
What You'll Learn
- Why traditional maintenance strategies fail and where AI fits
- Multi-agent architecture for sensor ingestion, anomaly detection, and root cause analysis
- Sensor data normalization and feature engineering for LLM consumption
- Hybrid anomaly detection: statistical thresholds + LLM pattern recognition
- LLM-driven root cause analysis with historical failure context
- ROI framework for predictive maintenance investments
Reading time: 13 minutes | Implementation time: 2-3 days for a working prototype
Current Maintenance Approaches and Their Limitations
Most industrial operations run one of three maintenance strategies, and each has fundamental problems.
Reactive maintenance is the "run to failure" model. You use equipment until it breaks, then fix it. This is cheap in the short term but devastating when a $500 bearing failure causes a $50,000 motor replacement because nobody caught the vibration anomaly three weeks earlier.
Preventive maintenance follows a calendar. Replace the pump seals every 6 months, swap the bearings every 12 months, regardless of actual condition. Studies show that 30-40% of preventive maintenance tasks are performed too early, wasting parts and labor. Worse, calendar intervals don't account for variable operating conditions — a compressor running at 90% capacity degrades faster than one at 60%.
Condition-based maintenance uses sensor data (vibration, temperature, pressure) to trigger maintenance when readings cross thresholds. This is better, but static thresholds generate excessive false alarms. A temperature spike from 85°C to 95°C might be critical for one motor but normal for another under load. Teams learn to ignore alerts, and the real failures slip through.
| Strategy | Annual Cost (per asset) | Downtime Impact | Key Weakness |
|---|---|---|---|
| Reactive | $15,000-$30,000 | High (unplanned) | Cascading failures |
| Preventive | $8,000-$15,000 | Medium (scheduled) | Wasteful replacements |
| Condition-based | $5,000-$10,000 | Low-Medium | Alert fatigue |
| AI Predictive | $3,000-$7,000 | Low | Initial setup complexity |
The AI-Powered Approach
Instead of static thresholds or calendar schedules, we build an agent that understands context. It ingests sensor telemetry, compares patterns against historical failure data, and generates maintenance recommendations with confidence scores and estimated time-to-failure.
The core insight is that LLMs are surprisingly good at pattern recognition when you structure the input correctly. A temperature reading of 92°C means nothing in isolation. But "Motor #47, bearing temperature trending from 78°C to 92°C over 72 hours, with vibration amplitude increasing 15% and historical failure records showing similar patterns preceded bearing seizure within 2 weeks" — that's a prompt an LLM can reason about effectively.
Key benefits of this approach:
- No custom ML models per equipment type — the LLM generalizes across equipment using structured context
- Human-readable explanations — maintenance teams get "why" not just "alert"
- Historical pattern matching — RAG retrieval against past failure records enriches analysis
- Adaptive thresholds — the agent learns what's normal for each specific asset under varying conditions
The tech stack: Azure OpenAI (GPT-4o) for reasoning, Azure IoT Hub for sensor ingestion, Azure AI Search for historical failure retrieval, and LangGraph (Python) or Semantic Kernel (C#) for orchestration.
Why LLMs Instead of Traditional ML?
Traditional ML models (LSTM, autoencoders) require thousands of labeled failure examples per equipment type and months of training data. LLM-based agents work with structured prompts and a handful of historical examples through RAG retrieval. The trade-off: higher per-inference cost but dramatically lower setup cost and time-to-value. For operations with fewer than 500 identical assets, the LLM approach often wins on total cost.
Architecture Overview
The system uses three specialized agents coordinated by an orchestrator. Each agent has a single responsibility, making the system debuggable and extensible.
- Ingestion Agent — Normalizes raw sensor telemetry into structured feature vectors with rolling statistics
- Anomaly Detection Agent — Combines statistical threshold checks with LLM-based pattern recognition to flag deviations
- Root Cause Agent — Retrieves historical failure records via RAG and generates diagnosis with maintenance recommendations
- Orchestrator — Routes sensor batches through the pipeline, manages state, and triggers alerts
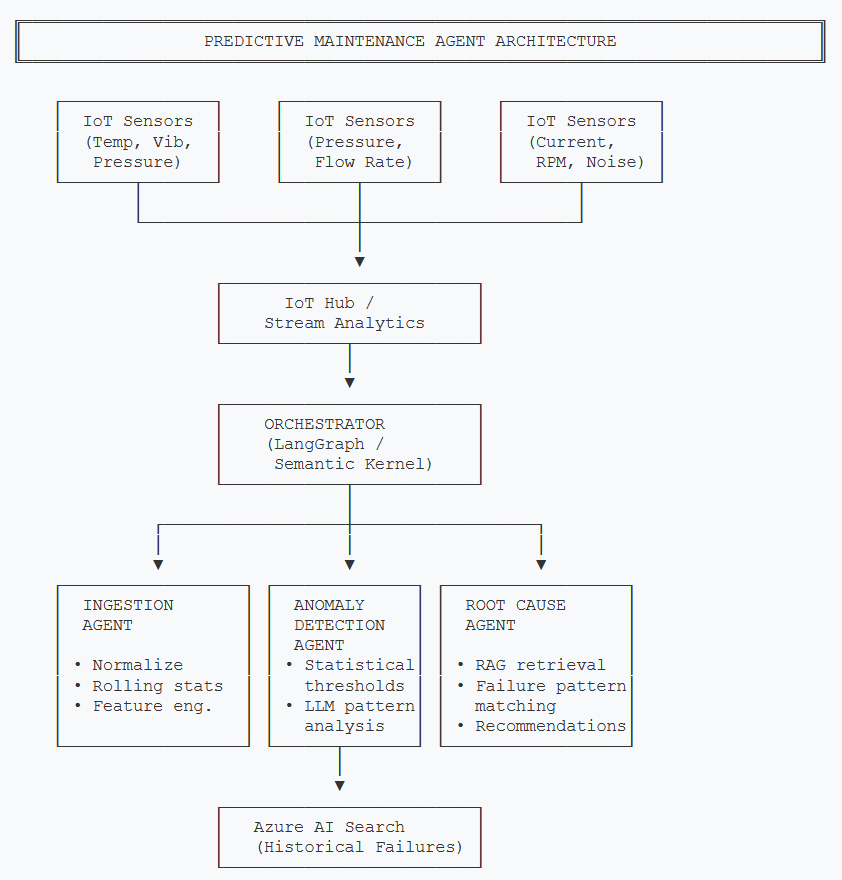
Sensor data flows through IoT Hub into the orchestrator, which pipelines through ingestion, anomaly detection, and root cause analysis agents
Why three agents instead of one big prompt? Each stage has different latency requirements. The ingestion agent runs on every sensor batch (sub-second). The anomaly detection agent fires only when features exceed baseline ranges (seconds). The root cause agent — the expensive one with RAG retrieval and GPT-4o reasoning — only triggers when anomalies are confirmed. This cascade keeps costs manageable.
Core Implementation
Pipeline State
The orchestrator maintains state as sensor data flows through each agent. Here's the shared state definition:
from typing import TypedDict, List, Optional
from dataclasses import dataclass
from datetime import datetime

@dataclass
class SensorReading:
    asset_id: str
    sensor_type: str        # "temperature", "vibration", "pressure"
    value: float
    unit: str
    timestamp: datetime

@dataclass
class AnomalyResult:
    is_anomaly: bool
    confidence: float       # 0.0 to 1.0
    deviation_pct: float    # how far from baseline
    pattern_description: str

@dataclass
class MaintenanceRecommendation:
    urgency: str            # "critical", "high", "medium", "low"
    action: str             # human-readable recommendation
    estimated_ttf: str      # time-to-failure estimate
    similar_failures: List[dict]
    confidence: float

class PipelineState(TypedDict):
    asset_id: str
    readings: List[SensorReading]
    features: Optional[dict]         # normalized feature vector
    anomaly: Optional[AnomalyResult]
    recommendation: Optional[MaintenanceRecommendation]
processing_stage: strpublic record SensorReading(
string AssetId,
string SensorType, // "temperature", "vibration", "pressure"
double Value,
string Unit,
DateTime Timestamp
);
public record AnomalyResult(
bool IsAnomaly,
double Confidence, // 0.0 to 1.0
double DeviationPct, // how far from baseline
string PatternDescription
);
public record MaintenanceRecommendation(
string Urgency, // "critical", "high", "medium", "low"
string Action, // human-readable recommendation
string EstimatedTtf, // time-to-failure estimate
List<FailureRecord> SimilarFailures,
double Confidence
);
public class PipelineState
{
public string AssetId { get; set; } = "";
public List<SensorReading> Readings { get; set; } = new();
public Dictionary<string, double>? Features { get; set; }
public AnomalyResult? Anomaly { get; set; }
public MaintenanceRecommendation? Recommendation { get; set; }
public string ProcessingStage { get; set; } = "ingestion";
}Building the Orchestration Graph
The orchestrator defines a pipeline: ingest → detect → (conditionally) diagnose. If no anomaly is detected, the pipeline short-circuits and skips the expensive root cause analysis.
from langgraph.graph import StateGraph, END

def build_maintenance_pipeline() -> StateGraph:
    workflow = StateGraph(PipelineState)

    # Add agent nodes
    workflow.add_node("ingest", ingest_agent)
    workflow.add_node("detect_anomaly", anomaly_detection_agent)
    workflow.add_node("diagnose", root_cause_agent)
    workflow.add_node("notify", send_notification)

    # Entry point
    workflow.set_entry_point("ingest")

    # Ingest always feeds into anomaly detection
    workflow.add_edge("ingest", "detect_anomaly")

    # Conditional: only diagnose if anomaly detected
    workflow.add_conditional_edges(
        "detect_anomaly",
        route_after_detection,
        {
            "anomaly_found": "diagnose",
            "normal": END,
        },
    )

    # Diagnosis always triggers notification
    workflow.add_edge("diagnose", "notify")
    workflow.add_edge("notify", END)

    return workflow.compile()


def route_after_detection(state: PipelineState) -> str:
    if state["anomaly"] and state["anomaly"].is_anomaly:
        return "anomaly_found"
return "normal"using Microsoft.SemanticKernel;
public class MaintenancePipeline
{
private readonly IngestionAgent _ingestion;
private readonly AnomalyDetectionAgent _anomaly;
private readonly RootCauseAgent _rootCause;
private readonly NotificationService _notifier;
public async Task<PipelineState> ProcessReadings(
PipelineState state)
{
// Step 1: Ingest and normalize
state = await _ingestion.ProcessAsync(state);
// Step 2: Detect anomalies
state = await _anomaly.DetectAsync(state);
// Step 3: Only diagnose if anomaly found
if (state.Anomaly?.IsAnomaly == true)
{
state = await _rootCause.DiagnoseAsync(state);
await _notifier.SendAlertAsync(state);
}
return state;
}
}Challenge #1: Sensor Data Normalization
Raw sensor data is messy. Temperature sensors report in Celsius or Fahrenheit. Vibration sensors use different units (mm/s, g-force, microns). Timestamps drift. Missing readings create gaps. Before an LLM can reason about equipment health, we need clean, consistent feature vectors.
The ingestion agent transforms raw readings into a normalized feature dictionary with rolling statistics. This is where domain knowledge matters — we compute features that correlate with degradation:
- Rolling mean and standard deviation (24-hour window) for trend detection
- Rate of change to catch rapid degradation
- Cross-sensor correlation (temperature vs. vibration) for pattern matching
import numpy as np
from collections import defaultdict

class IngestionAgent:
    """Normalizes raw sensor data into feature vectors."""

    def __init__(self, window_hours: int = 24):
        self.window_hours = window_hours
        self.baselines: dict[str, dict] = {}  # asset_id -> baseline stats

    async def process(self, state: PipelineState) -> PipelineState:
        readings = state["readings"]
        asset_id = state["asset_id"]

        # Group readings by sensor type
        by_sensor = defaultdict(list)
        for r in readings:
            by_sensor[r.sensor_type].append(r.value)

        # Compute feature vector
        features = {}
        for sensor_type, values in by_sensor.items():
            arr = np.array(values)
            features[f"{sensor_type}_mean"] = float(np.mean(arr))
            features[f"{sensor_type}_std"] = float(np.std(arr))
            features[f"{sensor_type}_max"] = float(np.max(arr))
            features[f"{sensor_type}_rate_of_change"] = (
                float(arr[-1] - arr[0]) / len(arr)
                if len(arr) > 1 else 0.0
            )

        # Compute cross-sensor correlation
        if "temperature" in by_sensor and "vibration" in by_sensor:
            temp = np.array(by_sensor["temperature"][-50:])
            vib = np.array(by_sensor["vibration"][-50:])
            if len(temp) == len(vib) and len(temp) > 2:
                features["temp_vib_correlation"] = float(
                    np.corrcoef(temp, vib)[0, 1]
                )

        state["features"] = features
        state["processing_stage"] = "detection"
return statepublic class IngestionAgent
{
private readonly int _windowHours;
public IngestionAgent(int windowHours = 24)
{
_windowHours = windowHours;
}
public Task<PipelineState> ProcessAsync(PipelineState state)
{
var bySensor = state.Readings
.GroupBy(r => r.SensorType)
.ToDictionary(g => g.Key, g => g.Select(r => r.Value).ToList());
var features = new Dictionary<string, double>();
foreach (var (sensorType, values) in bySensor)
{
features[$"{sensorType}_mean"] = values.Average();
features[$"{sensorType}_std"] = StdDev(values);
features[$"{sensorType}_max"] = values.Max();
features[$"{sensorType}_rate_of_change"] =
values.Count > 1
? (values.Last() - values.First()) / values.Count
: 0.0;
}
// Cross-sensor correlation
if (bySensor.TryGetValue("temperature", out var temp) &&
bySensor.TryGetValue("vibration", out var vib))
{
var minLen = Math.Min(
Math.Min(temp.Count, vib.Count), 50);
if (minLen > 2)
{
features["temp_vib_correlation"] =
Correlation(
temp.TakeLast(minLen).ToList(),
vib.TakeLast(minLen).ToList());
}
}
state.Features = features;
state.ProcessingStage = "detection";
return Task.FromResult(state);
}
private static double StdDev(List<double> values)
{
var avg = values.Average();
var sum = values.Sum(v => Math.Pow(v - avg, 2));
return Math.Sqrt(sum / values.Count);
}
private static double Correlation(
List<double> x, List<double> y)
{
var n = x.Count;
var avgX = x.Average();
var avgY = y.Average();
var num = Enumerable.Range(0, n)
.Sum(i => (x[i] - avgX) * (y[i] - avgY));
var denX = Math.Sqrt(x.Sum(v => Math.Pow(v - avgX, 2)));
var denY = Math.Sqrt(y.Sum(v => Math.Pow(v - avgY, 2)));
return denX * denY == 0 ? 0 : num / (denX * denY);
}
}The cross-sensor correlation is important: when bearing temperature and vibration amplitude start correlating strongly (above 0.7), it often signals mechanical degradation. A healthy bearing shows low correlation — temperature fluctuates with ambient conditions while vibration stays stable.
Challenge #2: Hybrid Anomaly Detection
Pure statistical anomaly detection (Z-scores, IQR) generates too many false positives. Pure LLM-based detection is too expensive to run on every sensor batch. The solution: a two-stage hybrid approach.
Stage 1 (fast, cheap): Statistical screening checks if any feature deviates more than 2 standard deviations from the asset's rolling baseline. This catches 80% of anomalies with zero LLM cost.
Stage 2 (slower, smarter): When Stage 1 flags a deviation, the LLM analyzes the full feature context — including cross-sensor correlations, rate of change, and recent history — to classify whether it's a real degradation signal or a benign operational change.
from openai import AsyncAzureOpenAI

class AnomalyDetectionAgent:
    """Two-stage hybrid anomaly detection."""

    ANALYSIS_PROMPT = """You are an industrial equipment health analyst.
Given the sensor features below, determine if this represents
a genuine degradation signal or a benign operational change.

Asset: {asset_id}
Equipment type: {equipment_type}

Current features:
{features_text}

Baseline (30-day rolling average):
{baseline_text}

Respond in JSON:
{{
  "is_anomaly": true/false,
  "confidence": 0.0-1.0,
  "pattern_description": "brief explanation"
}}"""

    async def detect(self, state: PipelineState) -> PipelineState:
        features = state["features"]
        baseline = self._get_baseline(state["asset_id"])

        # Stage 1: Statistical screening
        deviations = {}
        for key, value in features.items():
            if key in baseline:
                z_score = abs(value - baseline[key]["mean"]) / (
                    baseline[key]["std"] + 1e-6
                )
                if z_score > 2.0:
                    deviations[key] = z_score

        if not deviations:
            state["anomaly"] = AnomalyResult(
                is_anomaly=False, confidence=0.95,
                deviation_pct=0.0,
                pattern_description="All readings within baseline"
            )
            return state

        # Stage 2: LLM analysis for flagged features
        prompt = self.ANALYSIS_PROMPT.format(
            asset_id=state["asset_id"],
            equipment_type=self._get_equipment_type(state["asset_id"]),
            features_text=self._format_features(features),
            baseline_text=self._format_baseline(baseline),
        )

        response = await self.llm.chat.completions.create(
            model="gpt-4o",
            messages=[{"role": "user", "content": prompt}],
            temperature=0,
            response_format={"type": "json_object"},
        )

        result = json.loads(response.choices[0].message.content)
        state["anomaly"] = AnomalyResult(
            is_anomaly=result["is_anomaly"],
            confidence=result["confidence"],
            deviation_pct=max(deviations.values()) if deviations else 0,
            pattern_description=result["pattern_description"],
        )
        state["processing_stage"] = "diagnosis"
return stateusing Microsoft.SemanticKernel;
using System.Text.Json;
public class AnomalyDetectionAgent
{
private readonly Kernel _kernel;
private readonly BaselineService _baselines;
private const string AnalysisPrompt = """
You are an industrial equipment health analyst.
Given the sensor features below, determine if this represents
a genuine degradation signal or a benign operational change.
Asset: {0}
Equipment type: {1}
Current features:
{2}
Baseline (30-day rolling average):
{3}
Respond in JSON:
{{"is_anomaly": true/false, "confidence": 0.0-1.0,
"pattern_description": "brief explanation"}}
""";
public async Task<PipelineState> DetectAsync(
PipelineState state)
{
var baseline = _baselines.Get(state.AssetId);
// Stage 1: Statistical screening
var deviations = new Dictionary<string, double>();
foreach (var (key, value) in state.Features!)
{
if (baseline.TryGetValue(key, out var stats))
{
var zScore = Math.Abs(value - stats.Mean)
/ (stats.StdDev + 1e-6);
if (zScore > 2.0)
deviations[key] = zScore;
}
}
if (deviations.Count == 0)
{
state.Anomaly = new AnomalyResult(
false, 0.95, 0.0,
"All readings within baseline");
return state;
}
// Stage 2: LLM analysis
var prompt = string.Format(AnalysisPrompt,
state.AssetId,
_baselines.GetEquipmentType(state.AssetId),
FormatFeatures(state.Features),
FormatBaseline(baseline));
var result = await _kernel
.InvokePromptAsync<string>(prompt);
var parsed = JsonSerializer
.Deserialize<AnomalyResponse>(result!);
state.Anomaly = new AnomalyResult(
parsed!.IsAnomaly,
parsed.Confidence,
deviations.Values.Max(),
parsed.PatternDescription);
state.ProcessingStage = "diagnosis";
return state;
}
}Watch Your Token Budget
Stage 2 uses GPT-4o at ~$5 per million input tokens. If your statistical screening passes through too many false positives, LLM costs climb fast. Tune the Z-score threshold (we use 2.0) based on your false positive rate. Start strict (3.0) and lower gradually.
ROI and Business Value
Predictive maintenance ROI depends on three variables: your current downtime cost, the number of assets monitored, and how much unplanned downtime you can prevent.
Here's a framework for estimating your return:
| Metric | Before (Preventive) | After (AI Predictive) |
|---|---|---|
| Unplanned downtime events / year | 12-15 | 2-4 |
| Average downtime per event | 4-8 hours | 1-2 hours (planned repair) |
| Unnecessary part replacements | 30-40% of replacements | 5-10% of replacements |
| Mean time between failures | Baseline | +25-40% improvement |
ROI Framework
Annual savings = (Prevented downtime hours × hourly downtime cost) + (Avoided unnecessary replacements × average part cost) - (AI infrastructure cost)
For a mid-size manufacturing operation with 50 critical assets:
- Prevented downtime: 40 hours/year × $25,000/hour = $1,000,000
- Avoided replacements: 60 parts/year × $2,000/part = $120,000
- AI infrastructure cost: -$48,000/year
- Net annual savings: ~$1,072,000
The payoff is strongest for operations with high downtime costs (automotive, semiconductor, food processing) and for equipment where failure modes are well-documented in maintenance logs. If your historical records are sparse, the RAG-based root cause analysis won't perform as well — factor in 3-6 months of data collection before expecting full accuracy.
What's Next
In Part 1, we've covered the architecture and core implementation of a predictive maintenance agent: sensor ingestion with feature engineering, hybrid anomaly detection (statistical + LLM), and the orchestration pipeline that keeps costs manageable by only invoking expensive LLM analysis when statistical screening flags a deviation.
But building the prototype is the easy part. Production raises harder questions:
- What does this actually cost per asset per month?
- How do you trace a false positive back through the pipeline?
- When is this approach overkill — and what should you use instead?
Part 2 - Production Considerations
Part 2 covers cost analysis (real token and infrastructure numbers), observability patterns for debugging anomaly detection pipelines, Python vs C# trade-offs, Azure infrastructure with Foundry Agent Service, and when NOT to use AI-based predictive maintenance. Subscribe below to get notified when it's published.
This article demonstrates predictive maintenance agent concepts. Production code would need error handling, rate limiting, sensor data validation, and proper state persistence.
Want More Practical AI Tutorials?
I write about building production AI systems with Azure, Python, and C#. Subscribe for practical tutorials delivered twice a month.
Subscribe to Newsletter →