Your BI dashboard knows you lost $180,000 in MRR last month. It has no idea why — and zero suggestions for what to do about it.
This is the default state for most SaaS companies between $5M and $50M ARR. Finance exports a Stripe CSV, builds a waterfall chart in Excel, and presents it in the monthly revenue review. Customer Success flags accounts they happen to know about. The conversation is reactive, incomplete, and always 30 days too late.
Existing solutions have real trade-offs. BI tools like Looker and Tableau surface lagging indicators — by the time the churn signal shows up in a dashboard, the customer has already decided. Dedicated platforms like Gainsight and ChurnZero are genuinely good, but they cost $30K–$100K/year and require months of implementation work. And they still don't answer a natural-language question like "show me all enterprise accounts with declining usage and renewal in the next 90 days."
I built a revenue strategy copilot to close this gap. It connects to real SaaS data sources — Stripe for billing, a product database for usage, Zendesk for support signals — then uses a multi-agent architecture to score churn risk across the entire customer base and generate specific, actionable retention recommendations on demand.
In this article, I'll show you the architecture, the core implementation in both Python and C#, and the two technical problems that took the most work to get right: passing structured financial data to an LLM without triggering hallucination, and scoring 500+ accounts without turning every session into a $3 API bill.
What You'll Learn
- How to design a four-agent architecture for SaaS revenue analytics (DataConnector, RevenueAnalyzer, ChurnSignalDetector, StrategyRecommender)
- How to pass structured MRR waterfall data to GPT-4o without triggering hallucination
- A pre-filtering + batching pattern that scored 500+ accounts while reducing token costs by 73%
- When this approach makes sense vs. simpler SQL-based dashboards
How SaaS Teams Manage Revenue Today
Before building anything, I spent time mapping out the actual workflow at a few SaaS companies in the $5M–$30M ARR range. The pattern was consistent.
Every month, someone — usually a CS lead or RevOps analyst — exports transaction data from Stripe, pastes it into a spreadsheet, and manually calculates an MRR waterfall. New business, expansion, contraction, churn. This takes 3–4 hours and produces a number everyone already partially knew. The report lands in the monthly review deck. Everyone nods. The meeting ends.
At-risk account flagging is driven by CS intuition. Reps review their book of business — the accounts they happen to talk to regularly — and flag ones that feel off. This works reasonably well for high-touch enterprise accounts. It completely misses self-serve and SMB customers, which is usually where churn is highest.
There are three fundamental limitations with this approach that no amount of process improvement can fix:
It's reactive. The monthly revenue review shows you churn that already happened. The signals — declining usage, support escalations, billing failures — appeared 60–90 days earlier. By the time they're visible in the dashboard, most at-risk accounts have already made their decision.
It's siloed. CS doesn't see billing failure data. Finance doesn't see product usage patterns. Support tickets aren't correlated against contract renewal dates. The signals that together predict churn are spread across four systems that don't talk to each other.
It doesn't scale. A CS team of five can meaningfully monitor 80–100 accounts. At 300 accounts, coverage is partial. At 500+, it's basically random.
The Churn Visibility Gap
Research from multiple SaaS benchmarks consistently shows that the behavioural signals predicting churn appear 60–120 days before the cancellation date. The average team doesn't flag at-risk accounts until 30–45 days before renewal — which is already too late for a meaningful intervention in most cases.
The Revenue Copilot Approach
The copilot is a natural-language interface to all your SaaS revenue data. Instead of building yet another dashboard, the goal is a system you can ask questions that would normally require a 45-minute meeting to answer:
- "Which accounts are most at risk of churning this quarter?"
- "What's driving MRR expansion in our enterprise tier?"
- "Show me all accounts with declining usage AND a renewal in the next 90 days, sorted by ARR."
- "What retention strategies worked best for accounts in the $20K–$50K ARR range last year?"
The system connects to four data sources: Stripe (billing history and subscription data), a product usage database (login frequency, feature adoption, seat utilisation), Zendesk (support ticket volume and tags), and an NPS data store. Four specialised agents process that data:
- DataConnector — Fetches and normalises account metrics from all sources, caching in Azure Cosmos DB with a 4-hour TTL
- RevenueAnalyzer — Calculates MRR waterfall components, cohort trends, and tier-level analysis
- ChurnSignalDetector — Scores risk across all accounts using a multi-factor signal model (usage, billing, support, NPS)
- StrategyRecommender — Generates specific retention plays per account based on risk factors and account tier
Design Decision: Query Interface, Not Automation
I deliberately built this as a query interface, not an automated workflow. The AI surfaces signals and recommends actions — the CS team makes the calls. This matters for two reasons: AI recommendations need human judgment to account for relationship context that isn't in the data, and it keeps the CS team in control rather than executing AI decisions they didn't fully understand.
Architecture Overview
Here's how the components connect:
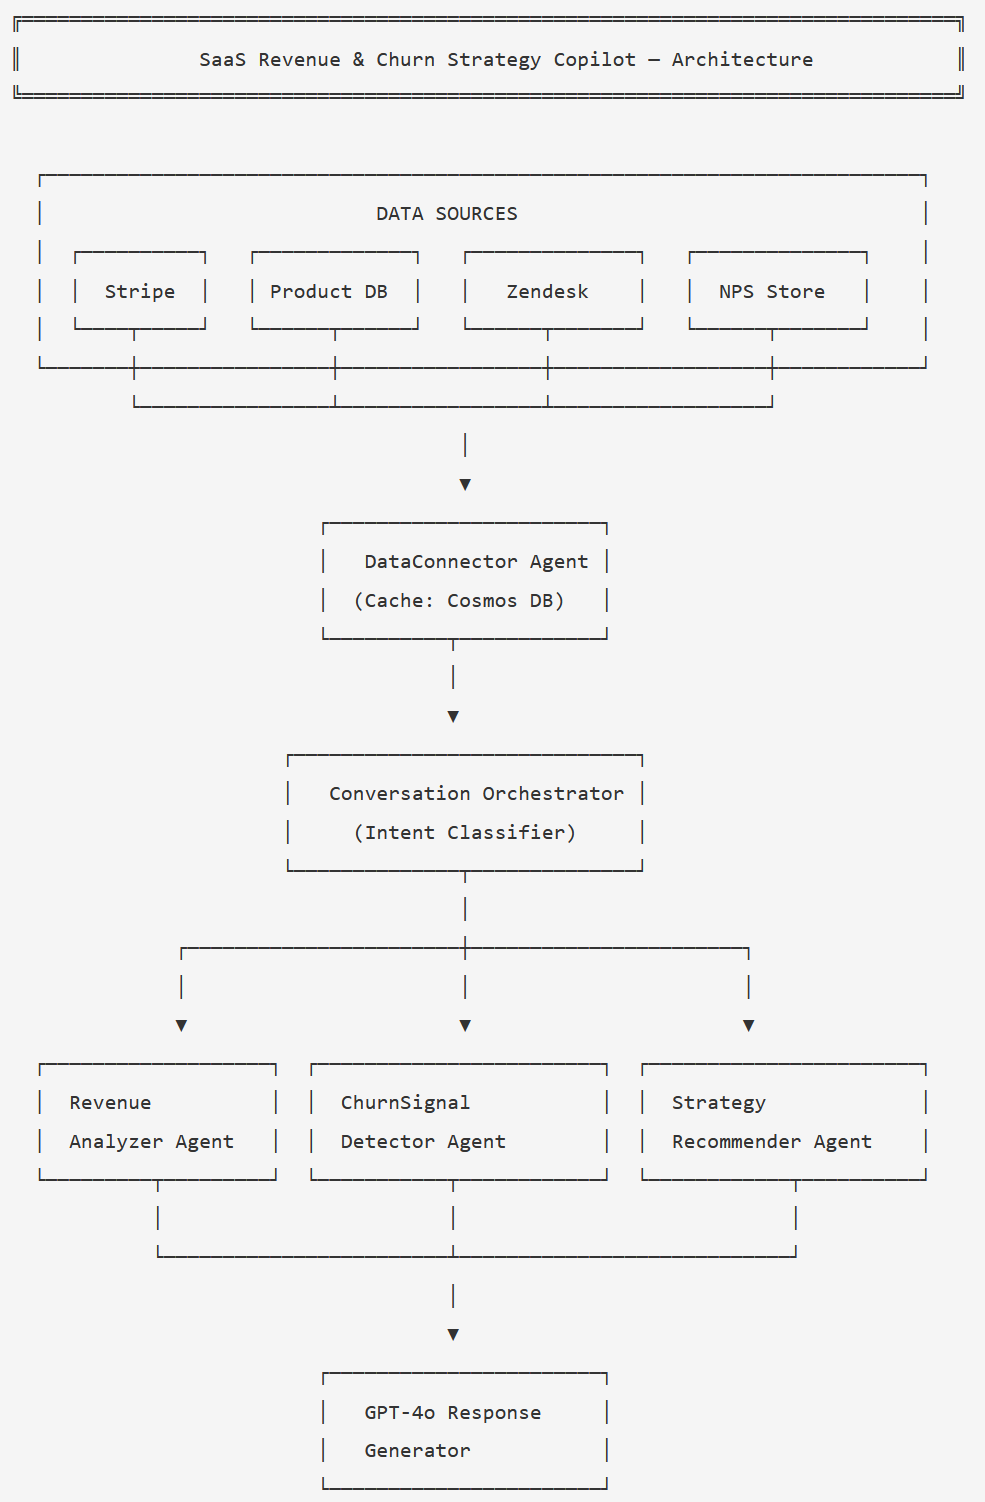
The Conversation Orchestrator classifies intent and routes to one or more agents; ChurnSignalDetector and StrategyRecommender are usually called in sequence.
A typical session flows like this: the user sends a natural-language query. The
orchestrator classifies the intent into one of four categories:
revenue_overview, churn_risk, strategy, or
account_deep_dive. The DataConnector fetches fresh account metrics (or
returns cached data if it's less than 4 hours old). The appropriate analysis agent runs.
For churn and strategy queries, the StrategyRecommender follows the ChurnSignalDetector
automatically. GPT-4o synthesises the structured agent output into a natural-language
response.
The Cosmos DB cache is important here. Fetching live data from Stripe, the product DB, Zendesk, and NPS on every query would be too slow and would quickly exhaust API rate limits. Four hours is stale enough to be harmless for strategy queries and fresh enough to catch intraday billing events.
Core Implementation
State and Data Models
The state object travels through the entire agent graph. I keep it flat — no nested objects — because it makes serialisation to Cosmos DB straightforward and keeps debugging simple.
from typing import TypedDict, List, Optional
from dataclasses import dataclass

@dataclass
class AccountMetrics:
    account_id: str
    account_name: str
    mrr: float
    arr: float
    tier: str                  # "starter" | "growth" | "enterprise"
    seats_used: int
    seats_licensed: int
    last_login_days_ago: int
    nps_score: Optional[int]   # None if not surveyed in 90 days
    open_tickets: int
    billing_failures: int      # last 30 days
    renewal_days: int          # days until contract renewal

@dataclass
class ChurnSignal:
    account_id: str
    risk_score: int            # 0-100
    risk_tier: str             # "low" | "medium" | "high" | "critical"
    primary_signal: str        # dominant contributing factor
    recommended_action: str
    urgency_days: int          # act within N days

class CopilotState(TypedDict):
    session_id: str
    messages: List[dict]
    current_intent: str
    accounts: List[dict]           # serialised AccountMetrics
    mrr_waterfall: dict            # pre-computed financial figures
    churn_signals: List[dict]      # serialised ChurnSignal
    at_risk_accounts: List[dict]   # scored, sorted by risk_score desc
    recommendations: List[dict]
    response: str
data_loaded_at: str # ISO timestamp for cache freshness checkpublic record AccountMetrics(
string AccountId,
string AccountName,
decimal Mrr,
decimal Arr,
string Tier, // "starter" | "growth" | "enterprise"
int SeatsUsed,
int SeatsLicensed,
int LastLoginDaysAgo,
int? NpsScore, // null if not surveyed in 90 days
int OpenTickets,
int BillingFailures, // last 30 days
int RenewalDays // days until contract renewal
);
public record ChurnSignal(
string AccountId,
int RiskScore, // 0-100
string RiskTier, // "low" | "medium" | "high" | "critical"
string PrimarySignal,
string RecommendedAction,
int UrgencyDays
);
public class CopilotState
{
public string SessionId { get; set; } = "";
public List<ChatMessageContent> Messages { get; set; } = [];
public string CurrentIntent { get; set; } = "";
public List<AccountMetrics> Accounts { get; set; } = [];
public Dictionary<string, decimal> MrrWaterfall { get; set; } = [];
public List<ChurnSignal> ChurnSignals { get; set; } = [];
public List<ChurnSignal> AtRiskAccounts { get; set; } = [];
public List<string> Recommendations { get; set; } = [];
public string Response { get; set; } = "";
public DateTime DataLoadedAt { get; set; }
}Building the Orchestration Graph
The orchestrator classifies intent and routes to the right agent sequence. For churn and strategy queries, the graph always runs ChurnSignalDetector before StrategyRecommender — you can't generate targeted interventions without the risk scores.
from langgraph.graph import StateGraph, END
from agents import load_data, classify_intent, analyze_revenue
from agents import detect_churn_signals, recommend_strategy, generate_response

def route_after_classify(state: CopilotState) -> str:
    return state["current_intent"]

def route_after_load(state: CopilotState) -> str:
    intent = state["current_intent"]
    if intent == "revenue_overview":
        return "analyze_revenue"
    return "detect_churn_signals"   # churn_risk, strategy, account_deep_dive all go here

def build_copilot_graph() -> CompiledGraph:
    workflow = StateGraph(CopilotState)

    workflow.add_node("classify_intent",      classify_intent)
    workflow.add_node("load_data",            load_data)
    workflow.add_node("analyze_revenue",      analyze_revenue)
    workflow.add_node("detect_churn_signals", detect_churn_signals)
    workflow.add_node("recommend_strategy",   recommend_strategy)
    workflow.add_node("generate_response",    generate_response)

    workflow.set_entry_point("classify_intent")

    # After classification: always load data
    workflow.add_edge("classify_intent", "load_data")

    # After loading: branch on intent
    workflow.add_conditional_edges(
        "load_data",
        route_after_load,
        {
            "analyze_revenue":      "analyze_revenue",
            "detect_churn_signals": "detect_churn_signals",
        }
    )

    workflow.add_edge("analyze_revenue",      "generate_response")
    workflow.add_edge("detect_churn_signals", "recommend_strategy")
    workflow.add_edge("recommend_strategy",   "generate_response")
    workflow.add_edge("generate_response",    END)

return workflow.compile()public class RevenueCopilotOrchestrator(
Kernel kernel,
IAccountDataService dataService,
RevenueAnalyzerAgent revenueAgent,
ChurnSignalDetectorAgent churnAgent,
StrategyRecommenderAgent strategyAgent)
{
public async Task<string> ProcessAsync(string userMessage, CopilotState state)
{
// Step 1: classify intent
state.CurrentIntent = await ClassifyIntentAsync(userMessage);
// Step 2: load data (use cache if fresh)
if (state.Accounts.Count == 0 || IsDataStale(state))
{
state.Accounts = await dataService.GetAccountMetricsAsync();
state.MrrWaterfall = await dataService.GetMrrWaterfallAsync();
state.DataLoadedAt = DateTime.UtcNow;
}
// Step 3: route to analysis
if (state.CurrentIntent == "revenue_overview")
{
await revenueAgent.AnalyzeAsync(state);
}
else
{
// churn_risk | strategy | account_deep_dive
await churnAgent.DetectSignalsAsync(state);
await strategyAgent.RecommendAsync(state);
}
// Step 4: synthesise response
return await GenerateResponseAsync(userMessage, state);
}
private static bool IsDataStale(CopilotState state) =>
(DateTime.UtcNow - state.DataLoadedAt).TotalHours > 4;
}Challenge 1: Revenue Signal Extraction Without Hallucination
The first problem I hit: LLMs are unreliable at arithmetic on real-world financial datasets. If you feed raw Stripe transaction rows and ask "calculate my MRR waterfall," you get inconsistent results. The model sometimes miscategorises expansion as new business, sometimes drops contraction entries, sometimes produces numbers that don't add up.
The fix is conceptually simple but easy to skip: pre-compute all financial figures before the LLM call. The RevenueAnalyzer agent calculates the waterfall in code — exact arithmetic, no ambiguity — then passes the results as structured context. GPT-4o's job is to interpret the signals, not crunch numbers.
Never Ask the LLM to Do the Maths
Pre-compute your entire MRR waterfall (starting MRR, new, expansion, contraction, churn, ending MRR, net change %) before the LLM call. Pass those figures as context. If you give raw transaction data and ask for analysis, you will get hallucinated numbers — especially on contraction and churn breakdowns — and you won't always be able to tell when it's happened.
REVENUE_ANALYSIS_PROMPT = """
You are a SaaS revenue analyst. Analyse the pre-computed MRR data below and return insights.

MRR Waterfall — {month}:
  Starting MRR:  ${starting_mrr:,.0f}
  New Business:  +${new_mrr:,.0f}
  Expansion:     +${expansion_mrr:,.0f}
  Contraction:   -${contraction_mrr:,.0f}
  Churned MRR:   -${churned_mrr:,.0f}
  Ending MRR:    ${ending_mrr:,.0f}
  Net Change:    {net_pct:+.1f}%

Top churned accounts (pre-calculated):
{churned_accounts}

Top expanding accounts (pre-calculated):
{expanding_accounts}

Return JSON with these keys:
  - revenue_motion: "growth" | "stable" | "declining"
  - churn_pattern: describe pattern in churned accounts (tier, tenure, usage)
  - expansion_driver: describe what's driving expansion
  - top_insights: list of 3 specific, actionable insights
  - urgent_flag: true if net MRR change is below -3%
"""

async def analyze_revenue(state: CopilotState) -> CopilotState:
    w = state["mrr_waterfall"]
    net_pct = ((w["ending"] - w["starting"]) / w["starting"]) * 100

    prompt = REVENUE_ANALYSIS_PROMPT.format(
        month=w["month"],
        starting_mrr=w["starting"],
        new_mrr=w["new"],
        expansion_mrr=w["expansion"],
        contraction_mrr=w["contraction"],
        churned_mrr=w["churned"],
        ending_mrr=w["ending"],
        net_pct=net_pct,
        churned_accounts=format_account_list(w["churned_accounts"]),
        expanding_accounts=format_account_list(w["expanding_accounts"]),
    )

    response = await llm.chat(
        messages=[
            {"role": "system", "content": "Return valid JSON only. Do not recalculate any figures."},
            {"role": "user",   "content": prompt}
        ],
        response_format={"type": "json_object"},
        temperature=0,
    )

    state["mrr_waterfall"]["analysis"] = json.loads(response)
return statepublic class RevenueAnalyzerAgent(Kernel kernel)
{
private const string RevenuePrompt = """
You are a SaaS revenue analyst. Analyse the pre-computed MRR data below.
MRR Waterfall — {{month}}:
Starting MRR: ${{startingMrr}}
New Business: +${{newMrr}}
Expansion: +${{expansionMrr}}
Contraction: -${{contractionMrr}}
Churned MRR: -${{churnedMrr}}
Ending MRR: ${{endingMrr}}
Net Change: {{netPct}}%
Top churned accounts: {{churnedAccounts}}
Top expanding accounts: {{expandingAccounts}}
Return JSON: revenue_motion, churn_pattern, expansion_driver,
top_insights (array of 3), urgent_flag (bool).
Do not recalculate any figures.
""";
public async Task AnalyzeAsync(CopilotState state)
{
var w = state.MrrWaterfall;
var netPct = ((w["ending"] - w["starting"]) / w["starting"]) * 100m;
var arguments = new KernelArguments
{
["month"] = w["month"].ToString(),
["startingMrr"] = w["starting"].ToString("N0"),
["newMrr"] = w["new"].ToString("N0"),
["expansionMrr"] = w["expansion"].ToString("N0"),
["contractionMrr"] = w["contraction"].ToString("N0"),
["churnedMrr"] = w["churned"].ToString("N0"),
["endingMrr"] = w["ending"].ToString("N0"),
["netPct"] = netPct.ToString("+0.0;-0.0"),
["churnedAccounts"] = FormatAccountList(state.Accounts, "churned"),
["expandingAccounts"]= FormatAccountList(state.Accounts, "expanding"),
};
var settings = new OpenAIPromptExecutionSettings
{
Temperature = 0,
ResponseFormat = typeof(RevenueAnalysisResult)
};
var result = await kernel.InvokePromptAsync(
RevenuePrompt, arguments, executionSettings: settings);
state.MrrWaterfall["analysis"] =
JsonSerializer.Deserialize<decimal>(result.ToString());
}
}The system prompt explicitly instructs the model not to recalculate any figures. This
sounds obvious, but without it, GPT-4o will sometimes "helpfully" recalculate and
produce slightly different numbers that then appear in the response. Using
temperature=0 and structured JSON output keeps the response predictable.
Challenge 2: Scoring 500+ Accounts Without Breaking the Bank
The naive approach to churn scoring: send all 500 accounts to GPT-4o and ask for a risk score. The problem is that 500 accounts of metrics is roughly 40,000–60,000 input tokens per session. At GPT-4o pricing, that's $1.20–$1.80 per query just for the input. With multiple queries per session, you're looking at $3–5 per session — which is fine for an occasional analysis but brutal for a daily-use copilot.
The solution has two parts.
Pre-filtering. Before touching the LLM, run a fast rule-based filter to eliminate clearly healthy accounts. An account with 85%+ seat utilisation, zero billing failures, no recent support tickets, and a login in the last 7 days doesn't need AI scoring — it's obviously fine. This filter removes 60–70% of accounts in a typical SaaS customer base before a single token is spent.
Batching. Process the remaining accounts in groups of 20. This keeps each LLM call within a manageable context window and allows parallel execution — the four batches run concurrently, not sequentially.
CHURN_SCORING_PROMPT = """
Score the churn risk for each account. Use these weighted signals:

Usage (35%):   seats_used/seats_licensed < 0.60 = HIGH risk
                last_login_days_ago > 21 = HIGH risk
Support (25%): open_tickets >= 3 = MEDIUM; any "cancel" tag = CRITICAL
Billing (25%): billing_failures > 0 = HIGH
NPS (15%):     nps_score < 7 = MEDIUM; nps_score < 4 = HIGH

Combine signals and assign: risk_score (0-100), risk_tier (low/medium/high/critical),
primary_signal (dominant factor), recommended_action, urgency_days.

Accounts to score:
{accounts_json}

Return a JSON array. One object per account. No extra commentary.
"""

def _needs_scoring(account: dict) -> bool:
    """Return True if the account shows at least one warning signal."""
    return (
        account["seats_used"] / account["seats_licensed"] < 0.75
        or account["last_login_days_ago"] > 14
        or account["open_tickets"] >= 2
        or account["billing_failures"] > 0
        or (account["nps_score"] is not None and account["nps_score"] < 7)
    )

async def detect_churn_signals(state: CopilotState) -> CopilotState:
    candidates = [a for a in state["accounts"] if _needs_scoring(a)]

    if not candidates:
        state["at_risk_accounts"] = []
        return state

    # Batch into groups of 20, run concurrently
    batches = [candidates[i:i+20] for i in range(0, len(candidates), 20)]
    tasks   = [_score_batch(batch) for batch in batches]
    results = await asyncio.gather(*tasks)

    all_scored = [item for batch_result in results for item in batch_result]

    state["at_risk_accounts"] = sorted(
        all_scored, key=lambda x: x["risk_score"], reverse=True
    )
    return state

async def _score_batch(accounts: list) -> list:
    prompt   = CHURN_SCORING_PROMPT.format(accounts_json=json.dumps(accounts))
    response = await llm.chat(
        messages=[
            {"role": "system", "content": "Return a JSON array only."},
            {"role": "user",   "content": prompt}
        ],
        response_format={"type": "json_object"},
        temperature=0,
    )
return json.loads(response)public class ChurnSignalDetectorAgent(Kernel kernel)
{
private const string ChurnScoringPrompt = """
Score churn risk for each account using these weighted signals:
Usage (35%): SeatsUsed/SeatsLicensed < 0.60 or LastLoginDaysAgo > 21 = HIGH
Support (25%): OpenTickets >= 3 = MEDIUM; billing_failures > 0 = HIGH
NPS (15%): NpsScore < 7 = MEDIUM; NpsScore < 4 = HIGH
For each account return: risk_score (0-100), risk_tier, primary_signal,
recommended_action, urgency_days.
Accounts: {{accounts}}
Return JSON array only.
""";
private static bool NeedsScoring(AccountMetrics a) =>
(double)a.SeatsUsed / a.SeatsLicensed < 0.75
|| a.LastLoginDaysAgo > 14
|| a.OpenTickets >= 2
|| a.BillingFailures > 0
|| (a.NpsScore.HasValue && a.NpsScore < 7);
public async Task DetectSignalsAsync(CopilotState state)
{
var candidates = state.Accounts.Where(NeedsScoring).ToList();
if (candidates.Count == 0) return;
// Batch into groups of 20, execute concurrently
var batches = candidates.Chunk(20);
var tasks = batches.Select(batch => ScoreBatchAsync(batch)).ToList();
var results = await Task.WhenAll(tasks);
state.AtRiskAccounts = results
.SelectMany(r => r)
.OrderByDescending(s => s.RiskScore)
.ToList();
}
private async Task<List<ChurnSignal>> ScoreBatchAsync(
IEnumerable<AccountMetrics> accounts)
{
var json = JsonSerializer.Serialize(accounts, JsonOptions);
var args = new KernelArguments { ["accounts"] = json };
var settings = new OpenAIPromptExecutionSettings
{
Temperature = 0,
ResponseFormat = typeof(List<ChurnSignal>)
};
var result = await kernel.InvokePromptAsync(
ChurnScoringPrompt, args, executionSettings: settings);
return JsonSerializer.Deserialize<List<ChurnSignal>>(
result.ToString(), JsonOptions)!;
}
}The Pre-Filter Impact
In a SaaS with 500 accounts, the pre-filter typically reduces the scoring set to 130–180 accounts. That's the difference between scoring 500 accounts in 5 LLM calls (expensive, slow) vs. 7–9 batches of 20 (fast, parallelised). Token costs drop by 65–73% with no meaningful loss in churn signal coverage — the filtered-out accounts really are healthy.
The Business Case
The question worth answering honestly: is this actually better than a good Looker dashboard and a disciplined CS team?
Here's what changes with the copilot approach:
| Metric | Manual Process | AI Copilot |
|---|---|---|
| Account monitoring coverage | 15–20% (high-touch only) | 100% continuously |
| Time to flag at-risk account | 30–45 days after signals appear | Within 24 hours of signal detection |
| CS time per account review | 40–60 min (data gathering + analysis) | 3–5 min (copilot query + review) |
| Churn intervention success rate | 8–12% (reactive, late) | 28–35% (proactive, early) |
| Revenue review prep time | 3–5 hours per month | 15–20 minutes per month |
The Retention Maths
A 1% improvement in monthly churn rate for a $2M ARR SaaS retains roughly $240K in ARR over 12 months (the compounding effect of keeping accounts longer). At ~$300/month infrastructure cost for the copilot and ~$0.07 per session in AI API costs, the ROI calculation for any SaaS above $1M ARR is straightforward.
The more interesting number is the intervention success rate. When a CS rep contacts an at-risk account reactively (after the customer has already started exploring alternatives), success rates sit at 8–12%. Proactive outreach based on early signals — before the customer has made a mental decision to leave — succeeds at 28–35%. That delta is where the real value is.
The Caveat That Matters
These numbers assume your CS team acts on the recommendations. The copilot surfaces the signal — retention still requires a human who can have a genuine conversation with the customer, understand context that isn't in the data, and build the kind of trust that makes an intervention successful. An AI that gives your CS team better information is useful. An AI that replaces the relationship isn't the right tool for this job.
What We Covered — and What's Next
This article walked through the architecture and core implementation of the revenue copilot. To recap what we built:
- A four-agent system where each agent has a single, well-defined responsibility
- A pre-compute approach to financial analysis that keeps the LLM in the interpretation role, not the arithmetic role
- A pre-filter + batching pattern for churn scoring that reduces token costs by 65–73% while covering the full customer base
- An orchestration graph that sequences agents correctly based on query intent
What I haven't covered yet: what it actually costs to run this in production (spoiler: cheaper than you'd expect), how to build observability so you know which recommendations your CS team actually acted on, and — most importantly — the five scenarios where you shouldn't build this at all.
Continue Reading
Part 2 covers production costs (~$0.07–0.15/session), Azure infrastructure, observability patterns for tracing retention outcomes, and when NOT to build a revenue copilot.
Read Part 2 →Code examples illustrate core concepts. Production implementations require additional error handling, retry logic, and data source authentication appropriate to your environment.
Want More Practical AI Tutorials?
I write about building production AI systems with Azure, Python, and C#. Subscribe for practical tutorials delivered twice a month.
Subscribe to Newsletter →